
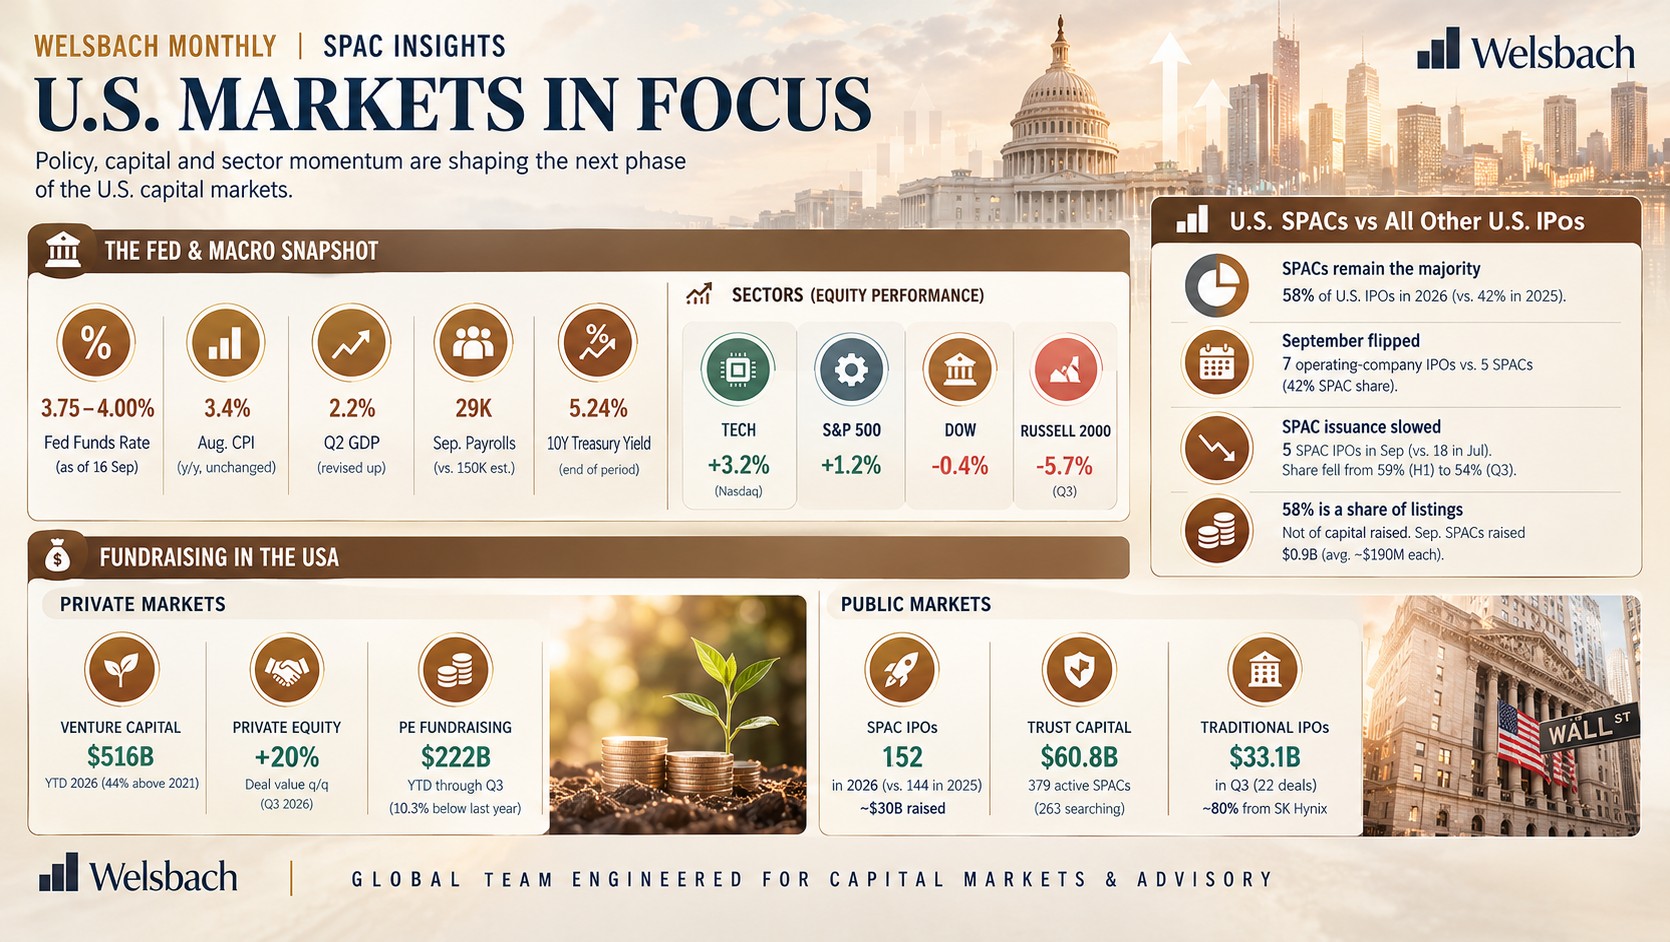
SPACs held 58% of U.S. IPOs with 152 priced for about $30 billion and 116 live deals worth $64.1 billion, even as the Fed hiked for the first time since 2023 and the 10-year yield hit 5.24%.
Originally published on Welsbach SPACtacular Insights (Substack)
We spend hours reading about, and talking to the smartest founders, dealmakers and investors in the SPAC landscape. This is our attempt to give you a short 5-10 minute summary on how we are thinking about the macro, markets and SPACs, and what lies ahead. Hundreds of hours summarized, so you don't have to.
Quick Macro TL;DR
| Category | Metric | Value | Notes |
|---|---|---|---|
| The Fed & Macro Snapshot | Fed Funds Rate | 3.75-4.00% | As of 16 Sep |
| Aug. CPI | 3.4% | y/y, unchanged | |
| Q2 GDP | 2.2% | Revised up | |
| Sep. Payrolls | 29K | vs. 150K est. | |
| 10Y Treasury Yield | 5.24% | End of period | |
| Sectors (Equity Performance) | Tech (Nasdaq) | +3.2% | |
| S&P 500 | +1.2% | ||
| Dow | -0.4% | ||
| Russell 2000 | -5.7% | Q3 | |
| Fundraising in the USA | Venture Capital | $516B | YTD 2026 (44% above 2021) |
| Private Equity | +20% | Deal value q/q (Q3 2026) | |
| PE Fundraising | $222B | YTD through Q3 (10.3% below last year) | |
| Public Markets | SPAC IPOs | 152 | In 2026 (vs. 144 in 2025), ~$30B raised |
| Trust Capital | $60.8B | 379 active SPACs (263 searching) | |
| Traditional IPOs | $33.1B | In Q3 (22 deals), ~80% from SK Hynix |
The Fed raised rates on 16 September for the first time since 2023, to 3.75-4.00%, and 16 of 18 officials expect at least one more increase this year. Inflation is stuck rather than accelerating: August CPI held at 3.4% and core PCE at 3.0%. Growth surprised upward (Q2 GDP revised to 2.2%) while hiring slowed to 29,000 in September. The 10-year Treasury yield ended the period at 5.24%. Equities split by sector: AI-heavy technology carried the Nasdaq Composite and S&P 500 to records, while the Dow and small caps lost ground.
The Good
- Inflation held steady instead of re-accelerating. August CPI rose 0.4% m/m and held at 3.4% y/y, in line with consensus, while core eased to 2.4% from 2.5% (BLS, 11 Sep). The in-line print ended a four-session S&P 500 losing streak: the S&P 500 rose 0.9%, the Dow 1.0% and the Nasdaq Composite 1.0% that day.
- Softer PCE, stronger growth. August PCE prices rose 0.3% m/m against a 0.4% consensus, with core at 0.2% (3.0% y/y), while Q2 GDP was revised up to 2.2% from 1.5% (BEA, 30 Sep). This weakened the stagflation case and lowered the odds of a near-term second hike, though the strong GDP figure kept yields high and the S&P 500 closed 0.3% lower that day.
- Hiring cooled enough to ease hike fears. September payrolls rose only 29,000, unemployment held at 4.2% and average hourly earnings were up 3.0% y/y (BLS, 2 Oct); July and August were also revised down by a combined 60,000. Traders pared bets on another hike; on 2 Oct the S&P 500 gained 0.7%, the Dow 0.5% and the Nasdaq Composite 1.2%.
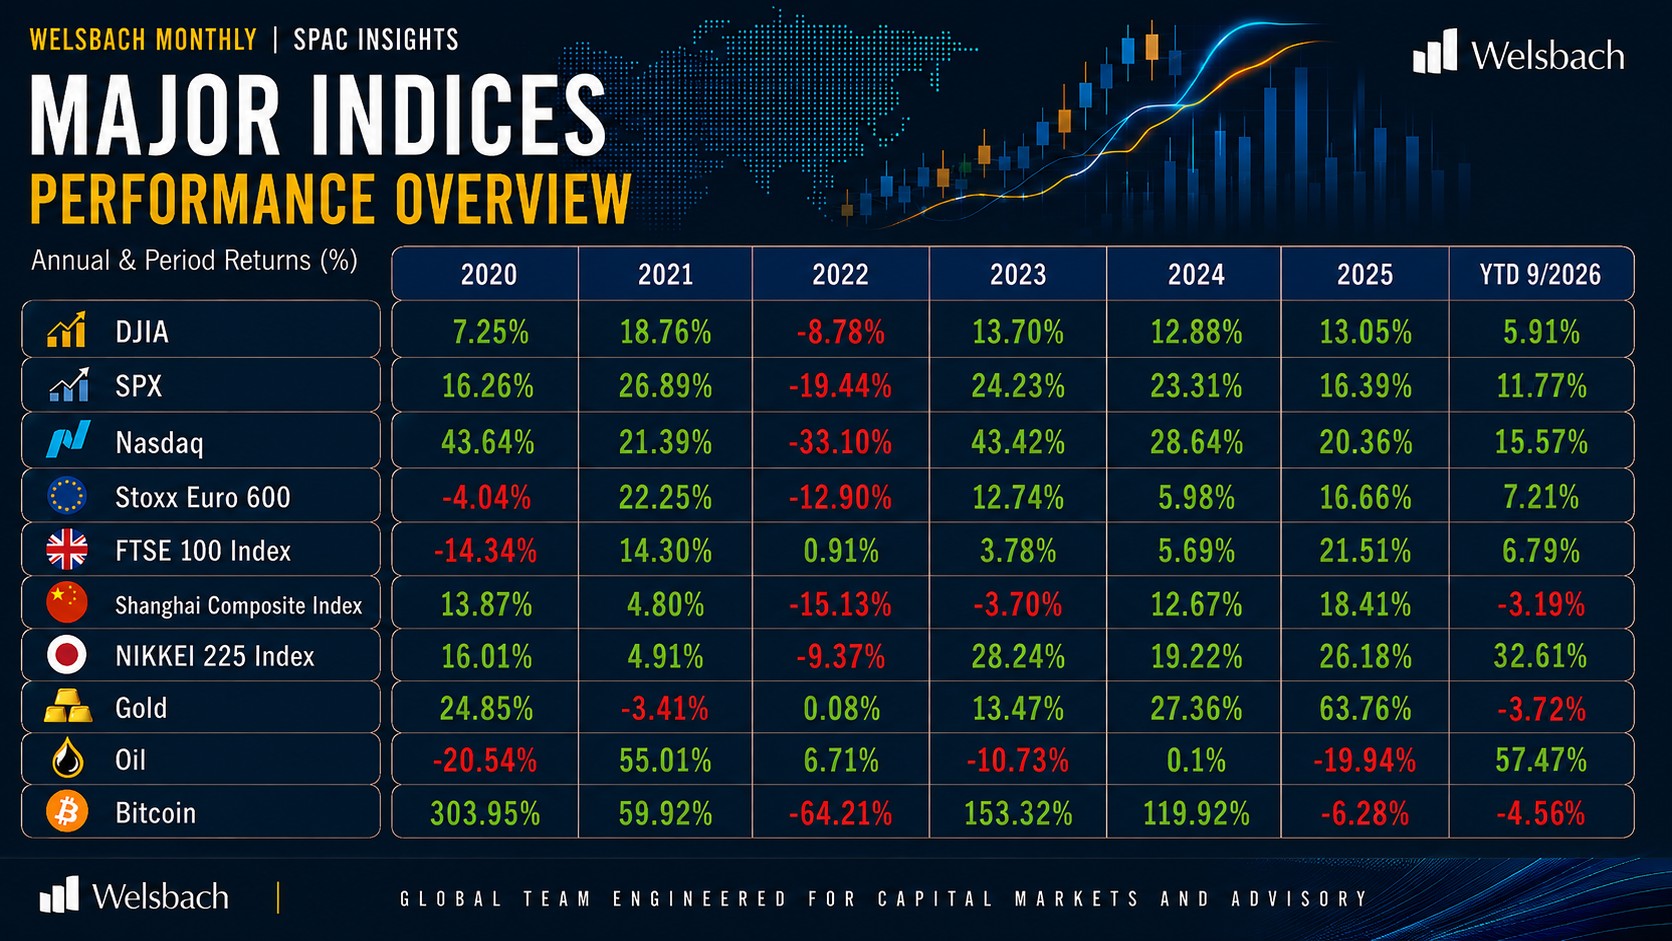
- Technology took the indices to new highs. The S&P 500 closed at a record 7,818.93 on 6 Oct, its 28th record close of 2026 and its first since 13 Aug; the Nasdaq Composite set its 24th record close at 27,599.79 the same day. Over the period the Nasdaq Composite gained 3.24%, and the S&P 500 rose 1.2% in the week to 9 Oct.
The Bad
- The Fed hiked and signalled more to come. The FOMC voted unanimously on 16 Sep to raise the funds rate 25 bp to 3.75-4.00%, its first increase since 2023, and the median projection points to 4.00-4.25% by year-end. Markets had priced the hike but not the guidance: the S&P 500 fell 0.45% to 7,551.81 and the Dow 1.21% to 51,461.90.
- Long-end yields hit 2007 levels. A business survey showing activity and input costs rising at the fastest pace in years pushed the 10-year yield to 5.11% on 23 Sep, a level last seen in 2007; the S&P 500 fell 0.8%, the Dow 0.7% and the Nasdaq Composite 1.1%. The 10-year ended the period at 5.24% (9 Oct), up from 4.78% on 2 Sep, which raises the discount rate applied to growth-company valuations.
- The Iran conflict kept energy prices high. Oil topped $100 a barrel ahead of the 11 Sep CPI release, and gasoline prices were 27.4% higher than a year earlier in August (BLS). The S&P 500 fell four sessions in a row into 10 Sep; for the week to 11 Sep the S&P 500 lost 0.8%, the Dow 1.6% and the Nasdaq Composite 0.7%.
- Gains were concentrated in a few large technology names. From 4 Sep to 9 Oct the Dow fell 3.29% and the Russell 2000 fell 5.67%, while the Nasdaq Composite rose 3.24%; even at the 6 Oct close the Dow was about 5% below its 5 Aug record. For issuers, small caps are the more relevant benchmark, since most de-SPAC companies trade alongside them.
U.S. SPACs versus All Other U.S. IPOs
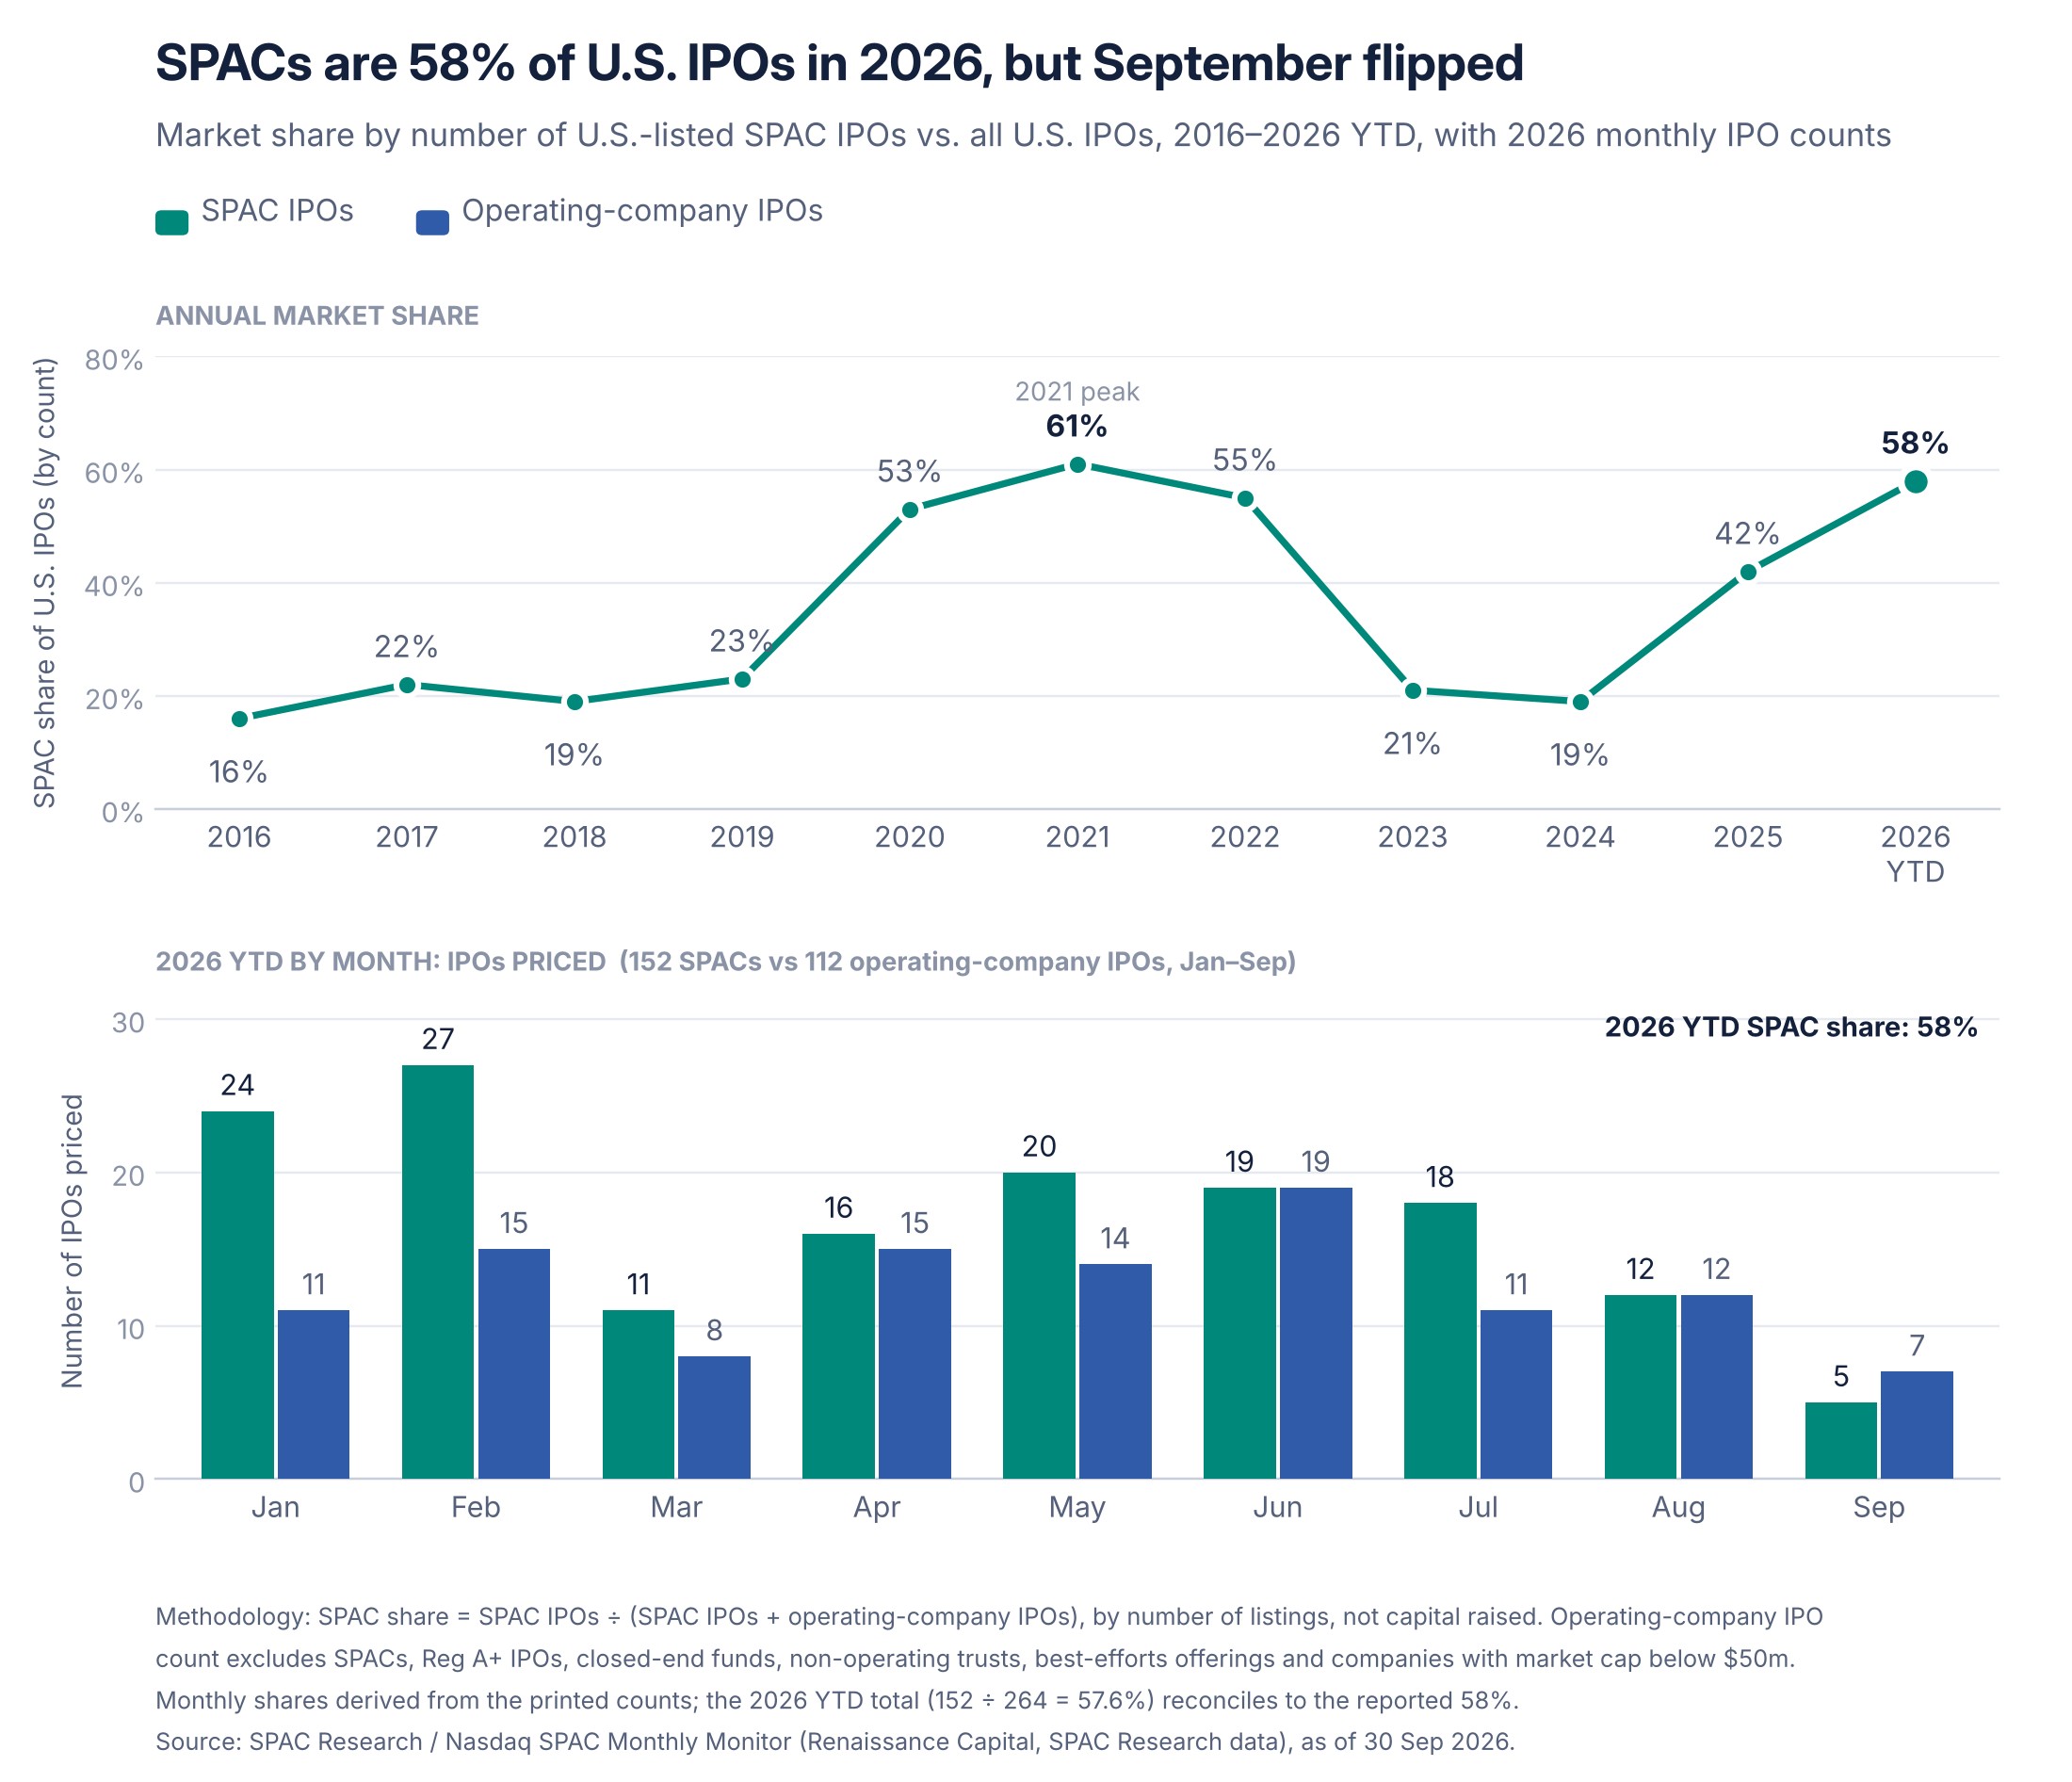
- SPACs remain the majority of U.S. listings. SPACs were 58% of U.S. IPOs by count in 2026 to 30 Sep (152 SPACs against 112 operating-company IPOs), up from 42% in 2025 and 19% in 2024, and just below the 61% peak of 2021.
- September was the first month of 2026 in which operating companies outnumbered SPACs. 7 operating-company IPOs priced against 5 SPACs, putting SPACs at 42% of the month's listings after the two had drawn level in June and August.
- SPAC issuance slowed more than operating-company issuance. Monthly SPAC IPOs fell from 18 in July to 12 in August and 5 in September, the lowest month of 2026. As a result, the SPAC share fell from 59% in H1 (117 of 199) to 54% in Q3 (35 of 65).
- The 58% is a share of listings, not of capital raised. September's five SPACs raised $0.9 billion, an average of about $190 million each. On that measure the SPAC is the most common route to a U.S. listing in 2026, but not the largest source of new equity.
Fundraising in the USA
Private Markets
- Venture investment has already set a full-year record. U.S. venture investment reached more than $98 billion across 3,640 companies in Q3 2026, bringing the year-to-date total to $516 billion, 44% above the previous full-year record set in 2021 (PitchBook-NVCA Venture Monitor, 8 Oct). AI accounted for 82.7% of 2026 deal value, so capital is plentiful for AI companies and scarce for most others. These figures measure capital invested, not funds raised.
- Private equity deals and exits recovered in Q3. U.S. PE deal value rose 20% q/q to $230.4 billion across 2,466 deals, and exit value rose 51% to $165.1 billion across 405 exits (PitchBook Q3 2026 PE First Look). Exit value grew much faster than exit count, so a few large sales drove the rebound and most sponsors still hold portfolios they have not sold.
- PE fundraising is slowing and concentrating in fewer funds. U.S. PE funds raised $222 billion YTD through Q3, a pace 10.3% below last year, across 348 funds, a pace 31.5% lower (PitchBook). Venture shows the same concentration: in H1 2026, three firms took 48% of the $72.4 billion raised. For founders, that makes the public markets a more important source of growth capital.
Public Markets
- SPAC IPO volume has passed last year's total. 152 SPAC IPOs priced in 2026 to 30 Sep, raising about $30 billion, which already exceeds 2025's full-year count of 144 and matches its roughly $30 billion; a further 83 vehicles are in registration seeking $10.3 billion (SPAC Research). Q3 alone accounted for 35 SPAC IPOs.
- Trust capital is large, but most of it will be redeemed. 379 active SPACs hold $60.8 billion in trust, of which 263 vehicles ($49.2 billion) are still searching and 116 have announced deals carrying $64.1 billion in equity value (SPAC Research, 30 Sep). Announced equity value is not capital a target will receive: at recent redemption rates, most of the trust cash leaves at closing.
- One listing dominated traditional IPO proceeds. Traditional U.S. IPOs raised $33.1 billion across 22 deals in Q3, of which SK Hynix's $26.5 billion Nasdaq ADR offering, the largest U.S. listing by a foreign issuer, accounted for about 80%; follow-ons added $53.0 billion and PIPEs/registered directs $5.1 billion (FactSet; SEC-registered deals above $20m). Because that dataset counts IPOs differently from SPAC Research, the figures are shown here for context only and are not combined with the counts above.
SPAC Issuance Activity (September 2026)
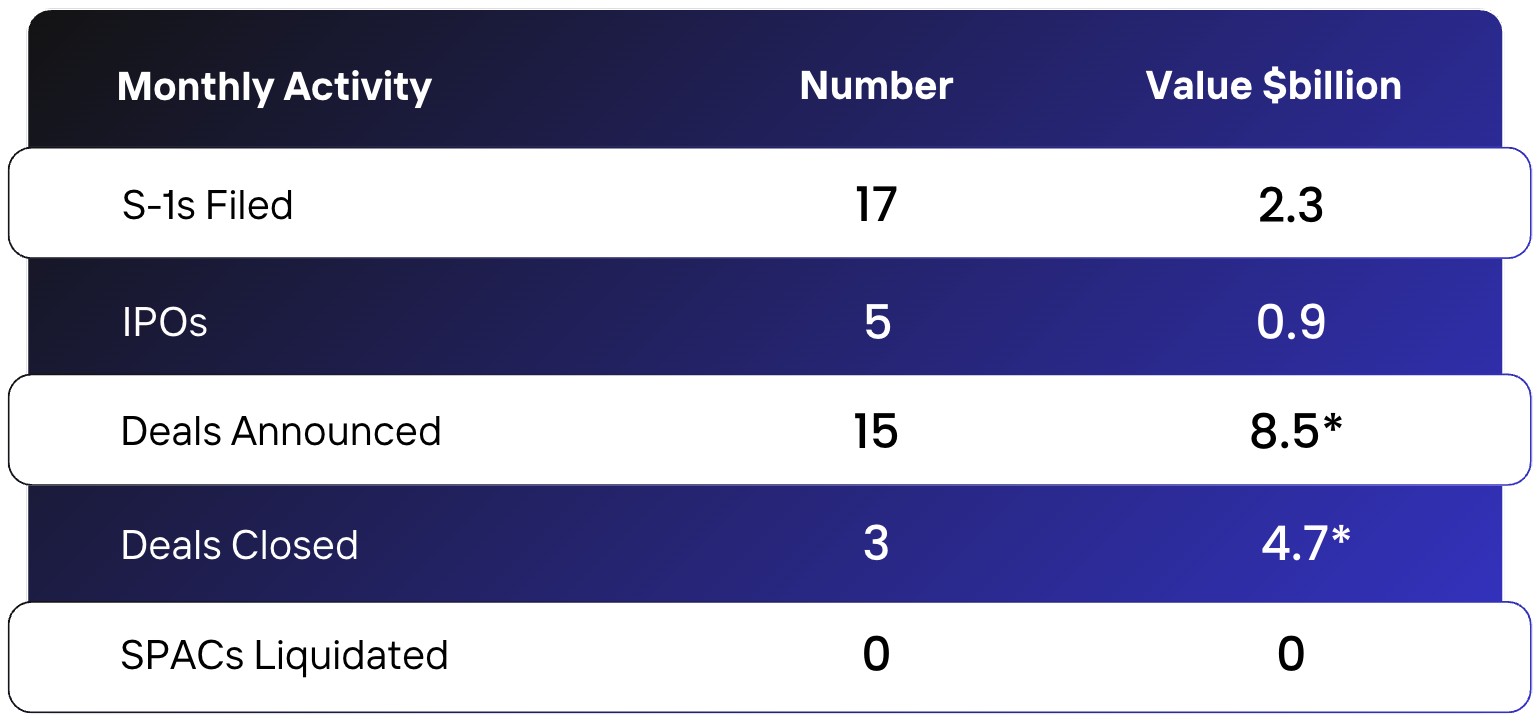
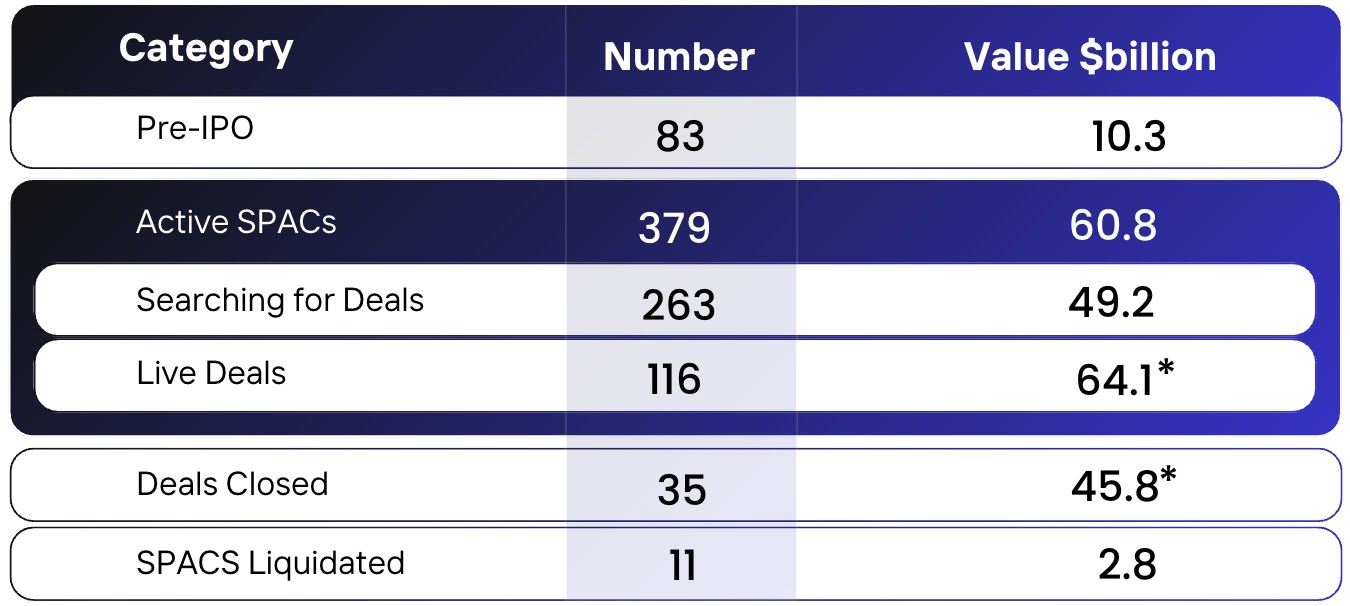
- 5 SPAC IPOs priced for $0.9 billion, the lowest monthly count of 2026 and less than half August's 12.
- 17 S-1s were filed for $2.3 billion, bringing the pre-IPO pipeline to 83 vehicles seeking $10.3 billion.
- 15 business combinations were announced for $8.5 billion, bringing live deals to 116 with $64.1 billion in equity value.
- 3 de-SPACs closed for $4.7 billion, bringing 2026 to 35 closings worth $45.8 billion.
- No SPACs liquidated, leaving 2026 at 11 liquidations returning $2.8 billion; 263 SPACs holding $49.2 billion remain in search.
Recent De-SPAC Transactions Closed
13 de-SPACs closed in Q3 2026 at a combined pro forma enterprise value of $15.7 billion. The table shows the 20 most recent closings, from 10 June to 1 October, alongside Welsbach Technology Metals Acquisition Corp. and Evolution Metals at a $6.5 billion pro forma enterprise value (closed 6 Jan 2026, Nasdaq: EMAT).
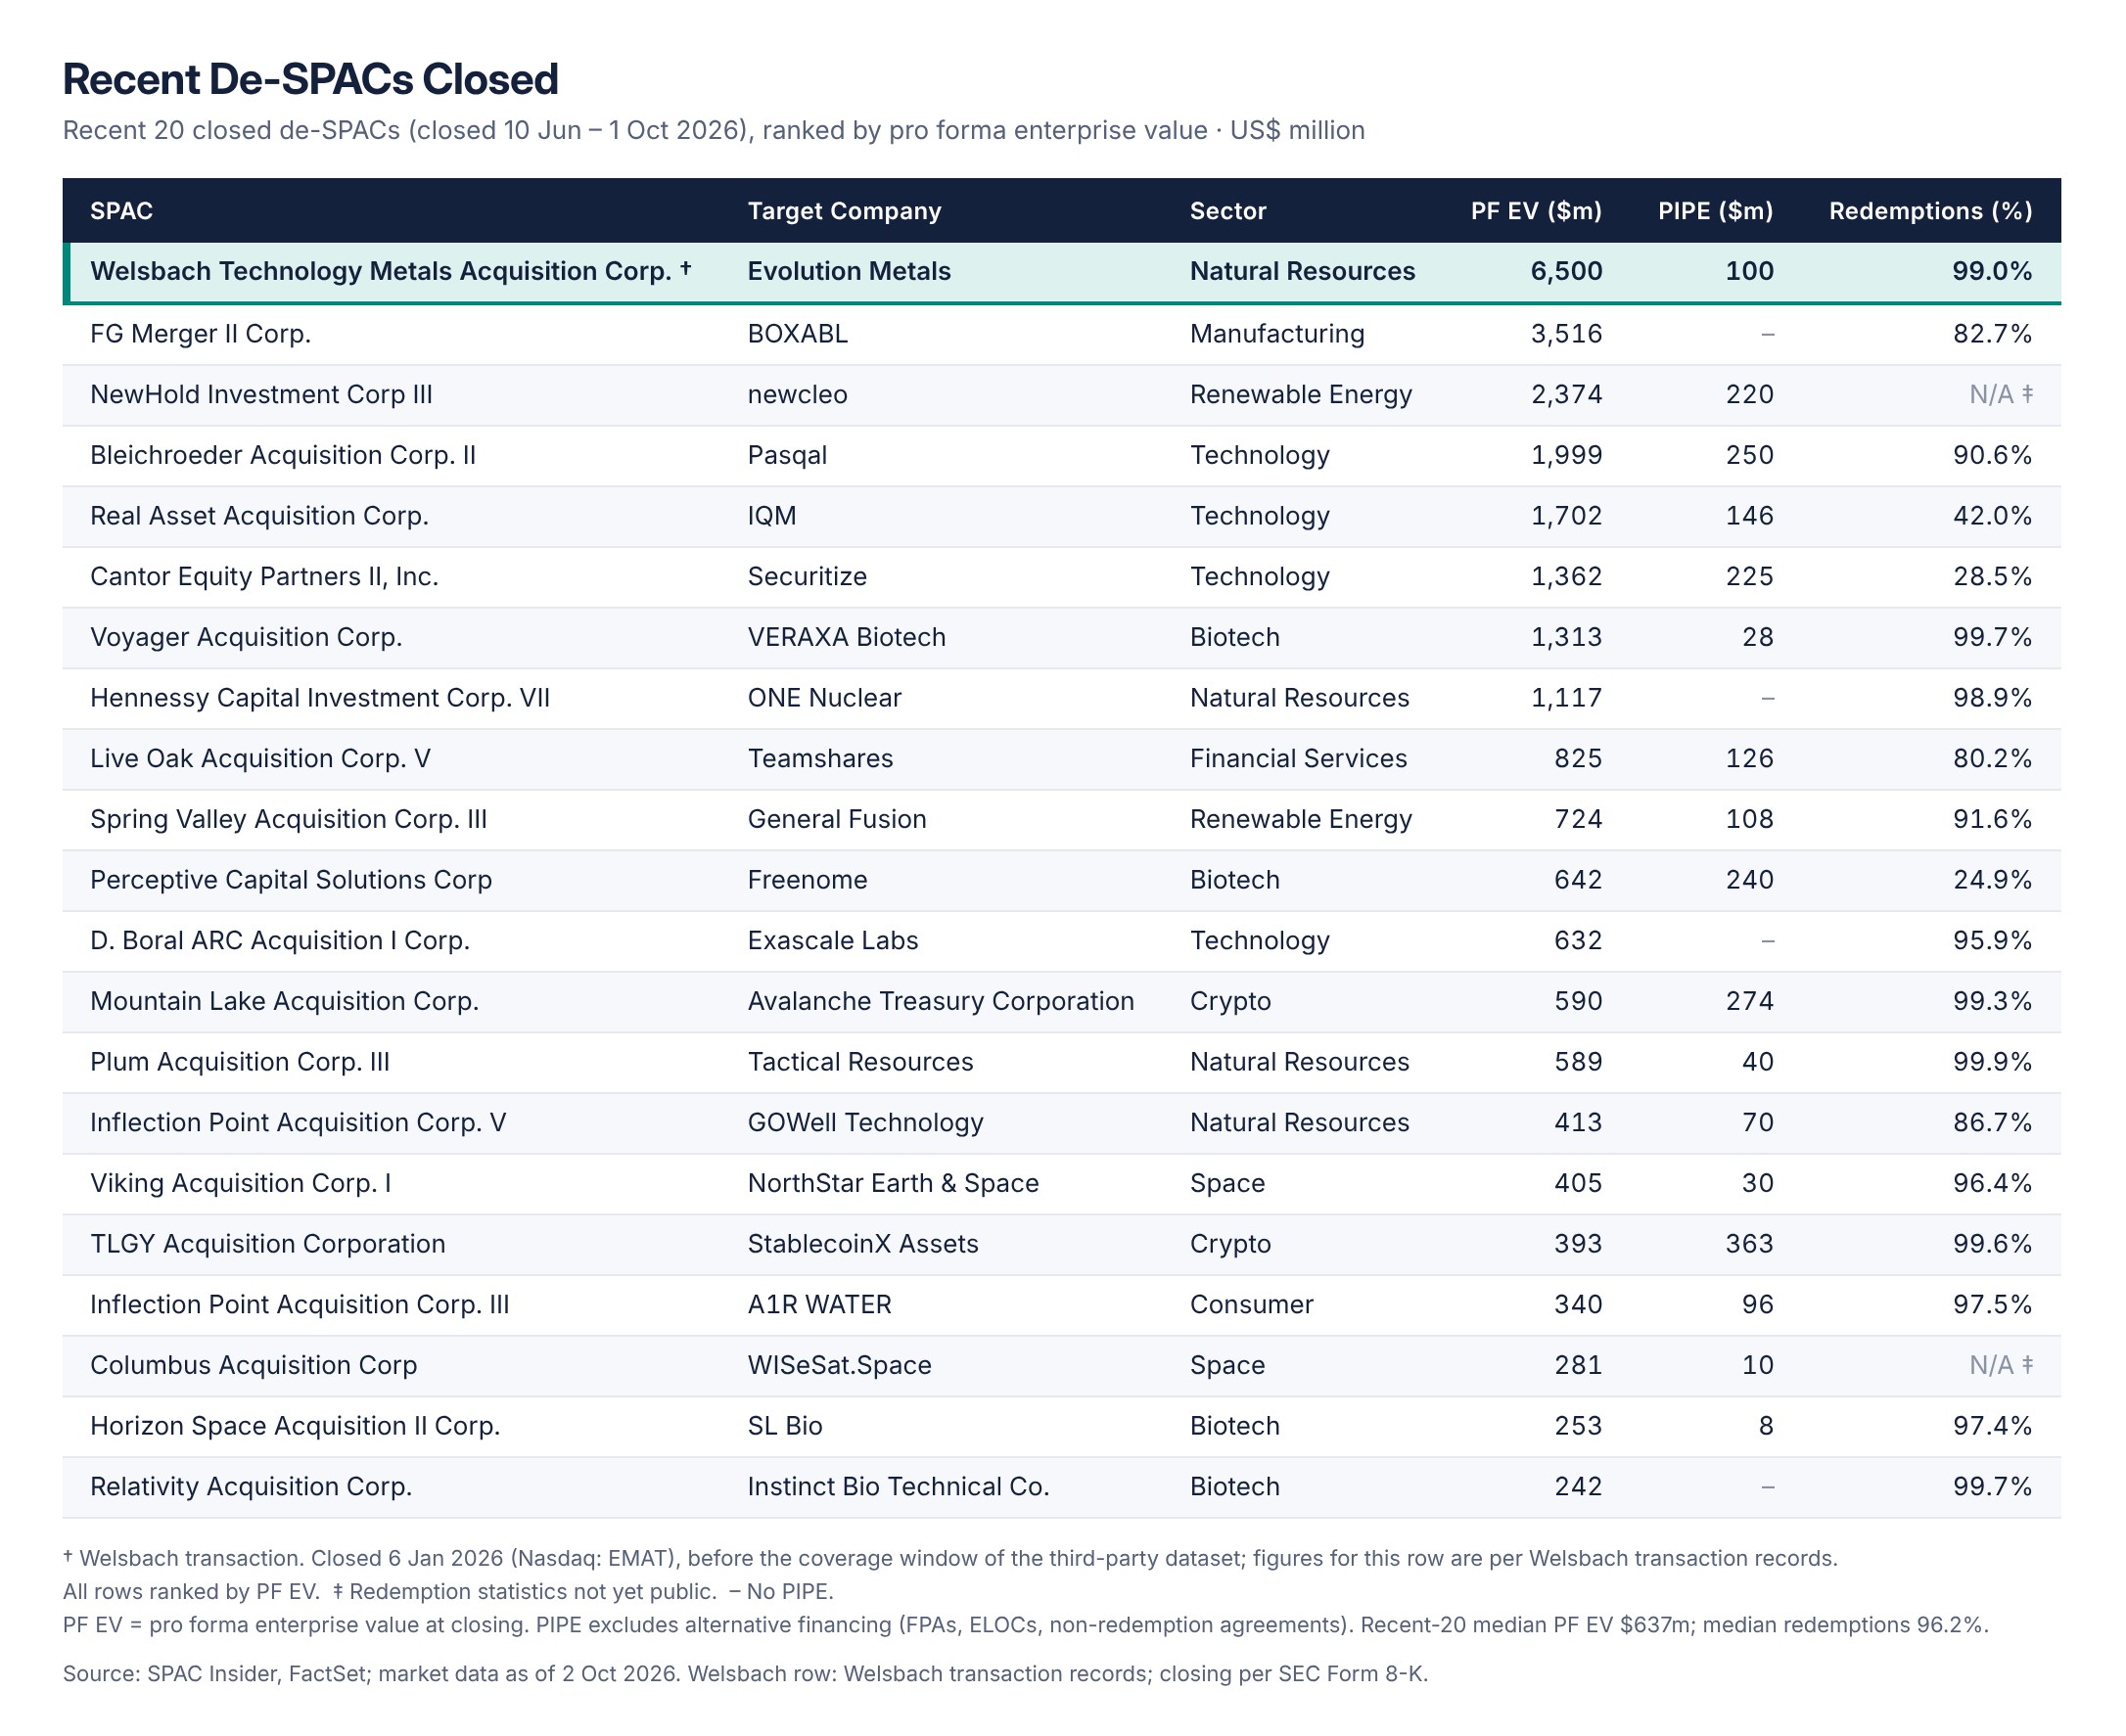
- Redemptions remain very high. Median redemptions across the recent 20 were 96.2% (mean 84.0%), and 15 of the 18 deals with reported figures exceeded 80%. Only Freenome (24.9%), Securitize (28.5%) and IQM (42.0%) came in below 50%, and each brought a PIPE of at least $146 million.
- Committed capital predicts aftermarket performance. All four deals trading above $10 (Freenome, StablecoinX, Securitize, IQM) raised PIPEs of $146 million or more, while none of the four deals that closed without a PIPE trades above $3.23 (prices as of 2 Oct).
- Deal sizes vary widely. Pro forma enterprise values range from $242 million to $3.5 billion, with a median of $637 million against a mean of $986 million, because a few large deals (BOXABL, newcleo, Pasqal) pull the average up.
Heatmap: Growing Sectors and Geographies

Growing Sectors in SPACs
- Technology leads new deals. 8 of the 20 most recently announced combinations are technology targets, including ACP Holdings / May Mobility ($1.48 billion EV), Bold Eagle / REDLattice ($1.25 billion equity value) and Texas Ventures III / PlusAI ($896 million EV).
- Space has become a distinct sector. Three recent announcements, Bleichroeder III / Ursa Major ($2.3 billion equity value), Black Spade III / Astrum Space ($1.0 billion equity value) and Proem / Astro Digital ($587 million EV), follow two space closings on 1 Oct: NorthStar Earth & Space and WISeSat.Space.
- Energy and resources deals are reaching completion. Natural resources and renewable energy account for 5 of the last 20 closings, led by nuclear: newcleo ($2.37 billion PF EV) and ONE Nuclear ($1.12 billion).
- Most new sponsors have not committed to a sector. 10 of the last 20 SPAC IPOs state a general mandate, so these vehicles can pursue whichever sectors public investors are rewarding when they search.
Leading Geographies
- U.S. targets dominate the strongest 2026 closings. 8 of the 10 best-performing 2026 de-SPACs by share price are U.S. companies (including Boost Run, StablecoinX, Freenome, Infleqtion and newcleo); the other two, Securitize and IQM, are global (SPAC Research).
- Asia has the highest-priced live deal. RF Acquisition II / Nanyang Biologics trades at $37.55, the highest of any live deal, and Asian targets hold three of the top ten places, including Super Apps Holdings and CUBEBIO ($813 million and $375 million equity value). U.S. targets hold four.
- European deals focus on energy and fintech. ClimateRock / GreenRock ($475 million equity value, energy) and Alpha Star / XDATA ($180 million, financial) are in the top ten live deals. Geography data covers only the top 10 by share price, so it shows where performance is concentrated rather than where deal volume is.
What If Your AI Could Work as a Team?
The next leap in AI isn't another chatbot. It's a team of specialized agents that can work together, share context, and tackle complex workflows.
That's the idea behind Brexy Agent Studio, where you can build, customize, and coordinate AI agents for financial research, financial modeling, M&A due diligence, and many more.
They are organised the way your firm is organised. They sit in teams, report to leads and answer in the channels your people already use. You @mention an agent the way you would message a colleague. Unlike some colleagues, it does not leave you to read.
Every user also gets BREXY, a personal agent that works like a chief of staff. It briefs you on what your teams finished, routes new work to the right desk, and taps you on the shoulder only when something needs your approval.
Ready to experience agentic AI for yourself? Join the Brexy Agent Studio and enjoy 1 month free. Build your agents. Bring them together. Rethink how work gets done.
Join Brexy Agent Studio - 1 Month Free
Meet BREXY, your personal chief-of-staff agent
Experience agentic AI - learn more at brexy.ai
Conclusion
September changed the pace of SPAC activity without changing its direction. SPACs still account for 58% of U.S. listings in 2026 and have already exceeded 2025's issuance count, the live-deal pipeline grew to 116 transactions and $64.1 billion, and no SPACs liquidated. New SPAC IPOs, however, slowed to five, and operating companies outnumbered them for the first time this year. With the Fed raising rates and 10-year yields above 5%, redemptions near 96% mean that trust cash rarely funds a closing. In this cohort, committed PIPE capital has been the clearest marker of which deals hold up after listing. For targets, readiness to raise that capital, including audited financials, credible projections and anchor investors, will matter more than securing a SPAC.
Exploring growth capital or a U.S. listing? Partner with the Welsbach team to make it happen. Email contact@welsbach.sg or reach us through the contact page.
Download
Take this edition with you
Register once to download this Welsbach Monthly edition as a branded PDF, including all charts and exhibits.