The AI trade broke in late October and the Nasdaq entered a correction, yet 11 SPAC combinations were announced and the live pipeline grew to 121 deals worth $71.5 billion. SPACs remain 57% of U.S. listings in 2026.
Originally published on Welsbach SPACtacular Insights (Substack)
De-SPACs, Fundraising & U.S. Capital Markets
The AI trade broke in late October. The Nasdaq Composite fell 8% over the period and entered a correction on 5 November, inflation picked up again, and markets now expect the Fed to raise rates in December. SPAC issuance stayed low for a second month, but deals kept coming: 11 combinations were announced in October and the live pipeline grew to 121 deals. This edition covers what that means for companies weighing a U.S. listing and for the auditors, counsel, underwriters and investors who take those deals to close.
Quick Macro TL;DR
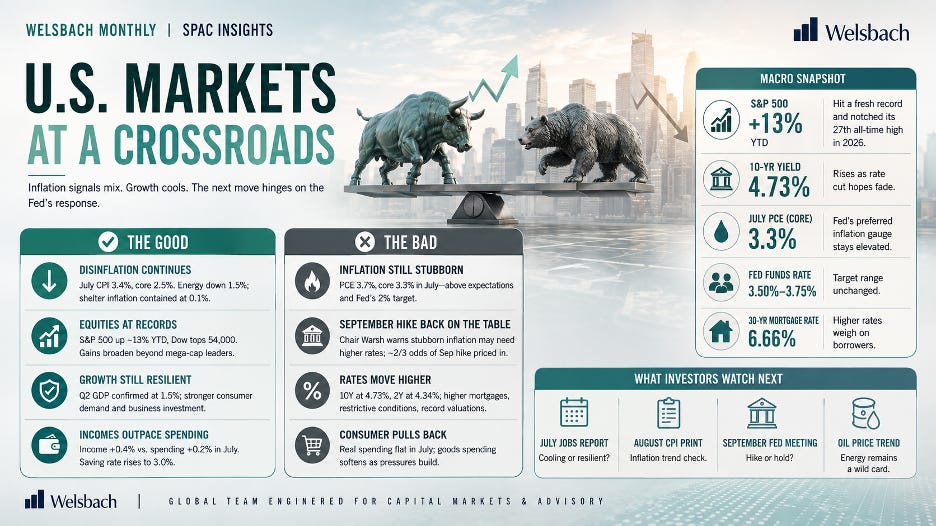
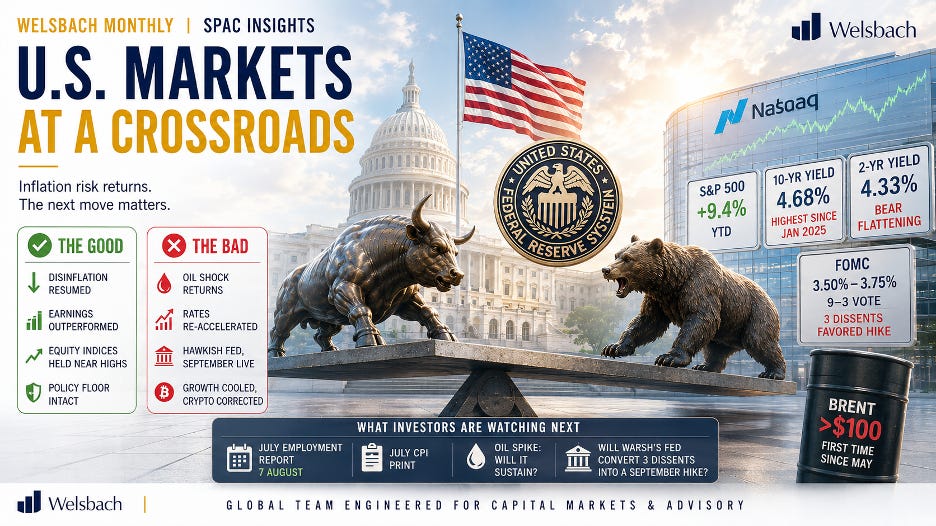
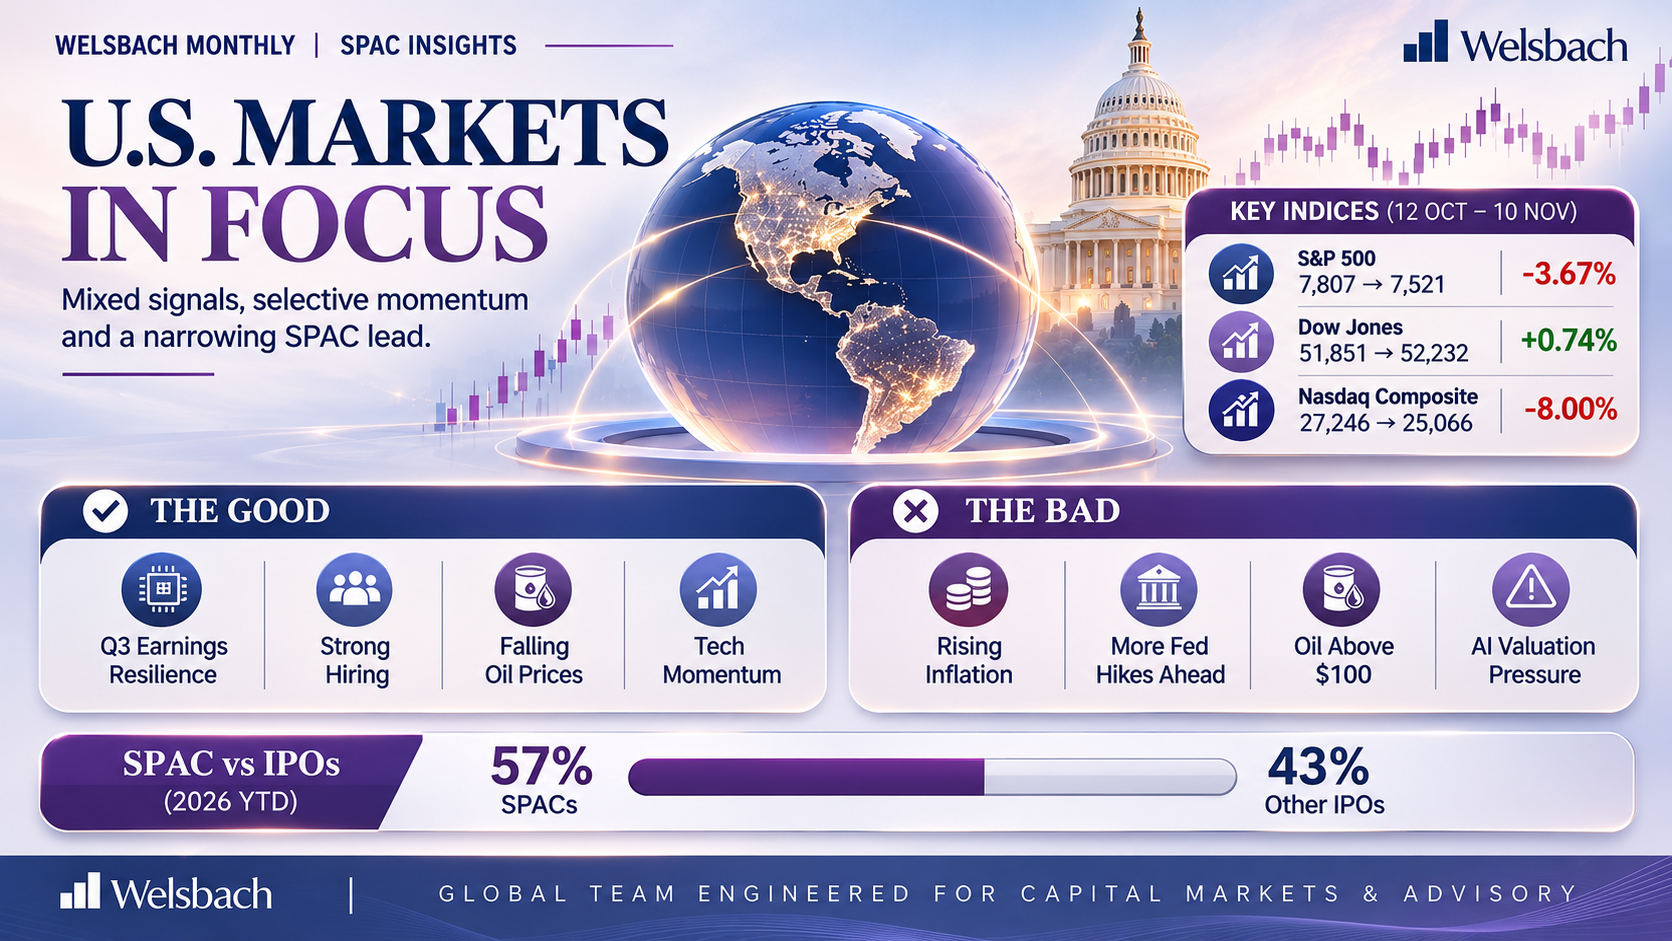
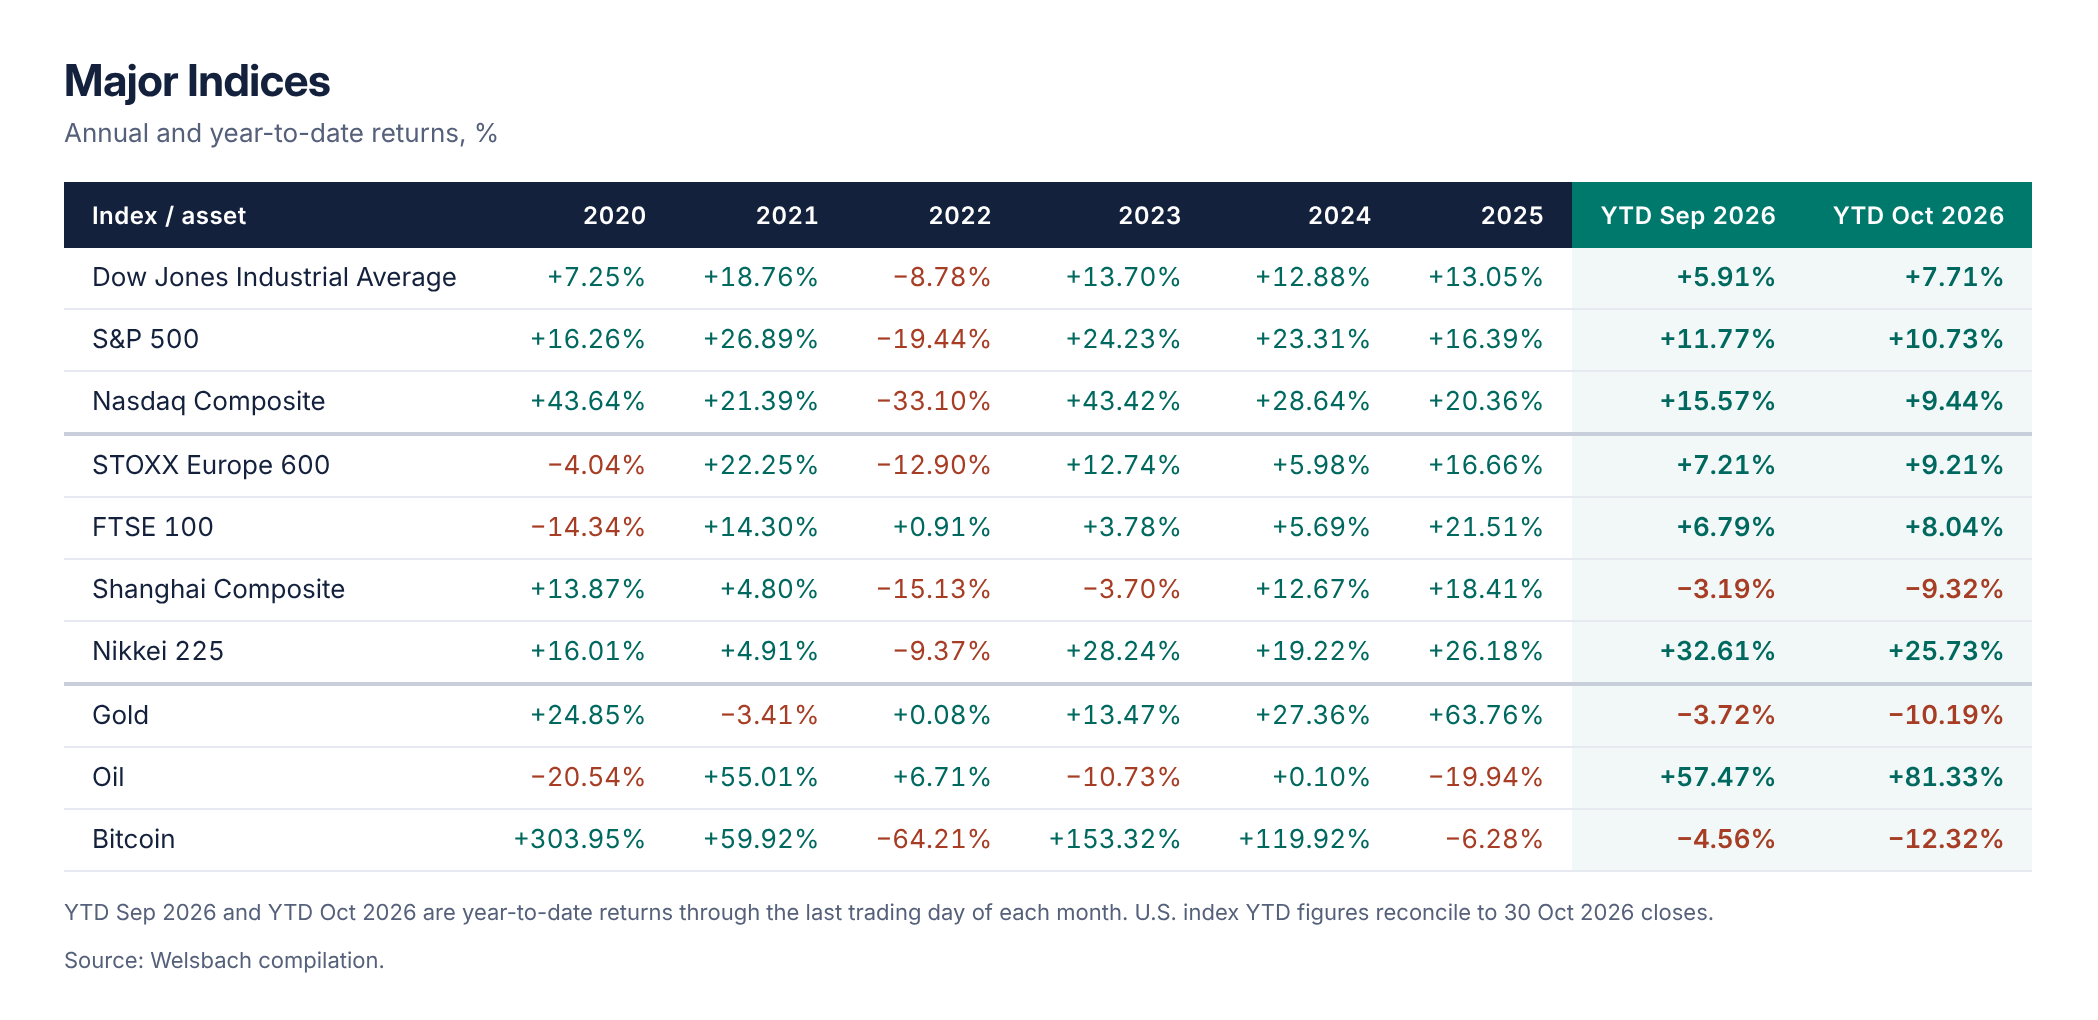
AI spending, not the Fed, drove markets. Alphabet fell 12.6% on 29 October, its worst day as a public company, after quarterly capex topped $51 billion and free cash flow turned negative. That started a sell-off in AI infrastructure stocks that ended with a 4.4% fall in the S&P 500 on 5 November. Inflation picked up: September CPI hit 3.7% y/y and October core CPI rose 0.3% m/m. The Fed held at 3.75-4.00% on 28 October with two dissents in favour of a hike, and futures price about an 80% chance of a December increase. Hiring rebounded to 165,000 in October. Democrats won both chambers of Congress on 3 November, which pushed oil lower but raised the prospect of limits on data-centre construction.
 View full size
The Good
- Q3 earnings held up despite the AI scare. With 60% of S&P 500 companies reporting by 30 Oct, 82% beat EPS estimates and blended growth was 30.2% y/y, a third straight quarter above 25% (FactSet). Strength outside big tech helped the Dow rise 1.7% in October while the Nasdaq Composite fell 5.3%.
- The midterm result pulled oil lower. After Democrats won both chambers on 3 Nov, Brent fell nearly 9% on 4 Nov as traders cut the odds of renewed fighting with Iran. The Dow gained about 3%, more than 1,500 points, in the market's best session in three months.
- Hiring rebounded. October payrolls rose 165,000 against a 65,000 consensus, unemployment fell to 4.1% and August-September were revised up by a combined 84,000 (BLS, 6 Nov). That lowers recession risk for issuers' revenue plans, though the same data lifted December hike odds to about 80% from 70%.
- Falling oil set off a broad relief rally. On 9 Nov, after the President played down the chance of renewed strikes on Iran, the S&P 500 rose 2.3%, the Dow 2.2%, the Nasdaq Composite 2.7% and the Russell 2000 3.1%, with all 11 sectors higher. Consumers' year-ahead inflation expectations eased to 4.3% from 4.7% (University of Michigan, preliminary November).
The Bad
- Investors turned on AI spending. Alphabet fell 12.6% on 29 Oct, and on 5 Nov data-centre stocks led a 4.4% fall in the S&P 500 to 7,353.73, its worst day since the April 2025 tariff sell-off; Nvidia fell 9.3% and AMD 17.3%. The Nasdaq Composite dropped 5.5% that day to 11.9% below its October record, a correction, and ended the period down 8.00%.
- Inflation picked up again. September CPI rose 0.6% m/m and 3.7% y/y, above the 3.6% expected, and core rose to 2.6% from 2.4% (BLS, 14 Oct); the S&P 500 fell 1.1% and the Nasdaq Composite 1.9%, the worst session since July. October core CPI then rose 0.3% m/m, also above forecasts (10 Nov); the BLS published no year-on-year rates for October because October 2025 prices were not collected during the government shutdown.
- The Fed moved closer to a second hike. The FOMC held at 3.75-4.00% on 28 Oct, but Governor Cook and Cleveland Fed President Hammack dissented in favour of a 25 bp hike, and Governor Waller later said a 50 bp move "should be considered" if October core CPI came in at 0.3% or higher, which it did. On the 10 Nov CPI release, the S&P 500 fell 0.4%, the Dow 0.3% and the Nasdaq Composite 0.7%.
- Oil above $100 and AI debt worries hit together in mid-October. Brent settled at $109.86 on 16 Oct, up from about $72 in late February, as investors questioned whether debt-funded AI infrastructure companies could keep up with rising borrowing costs. The S&P 500 fell 1.1% and the Nasdaq Composite 2.1% that day, capping the S&P 500's worst week since late June (-1.95%).
U.S. SPACs v/s. All Other U.S. IPOs
 View full size
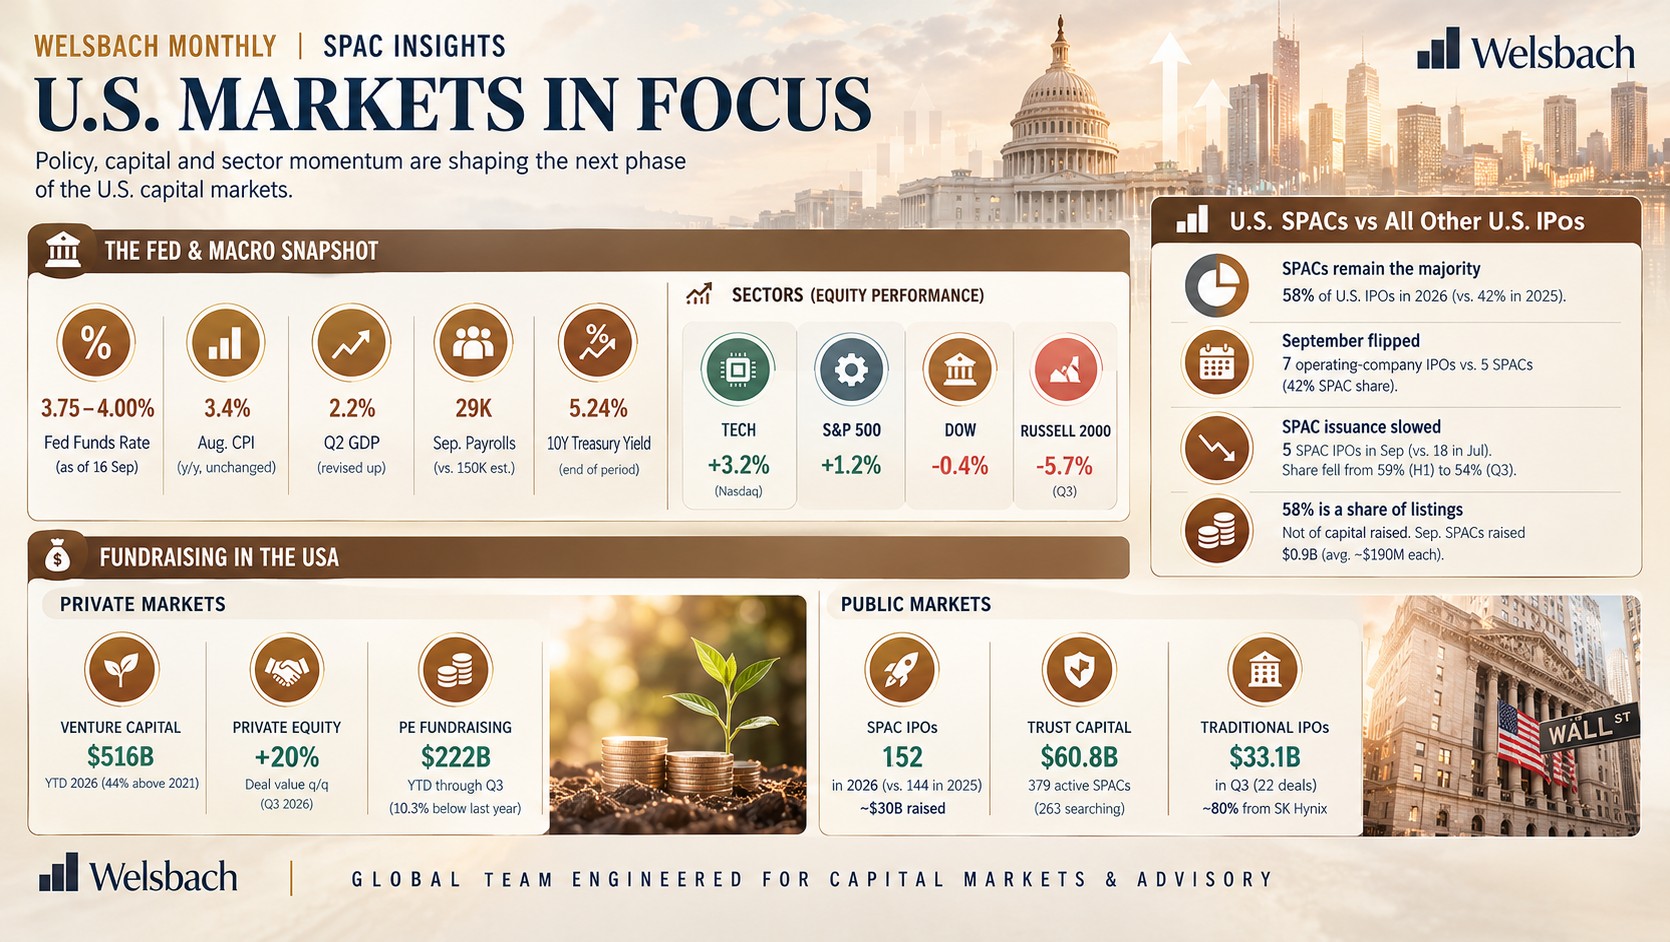
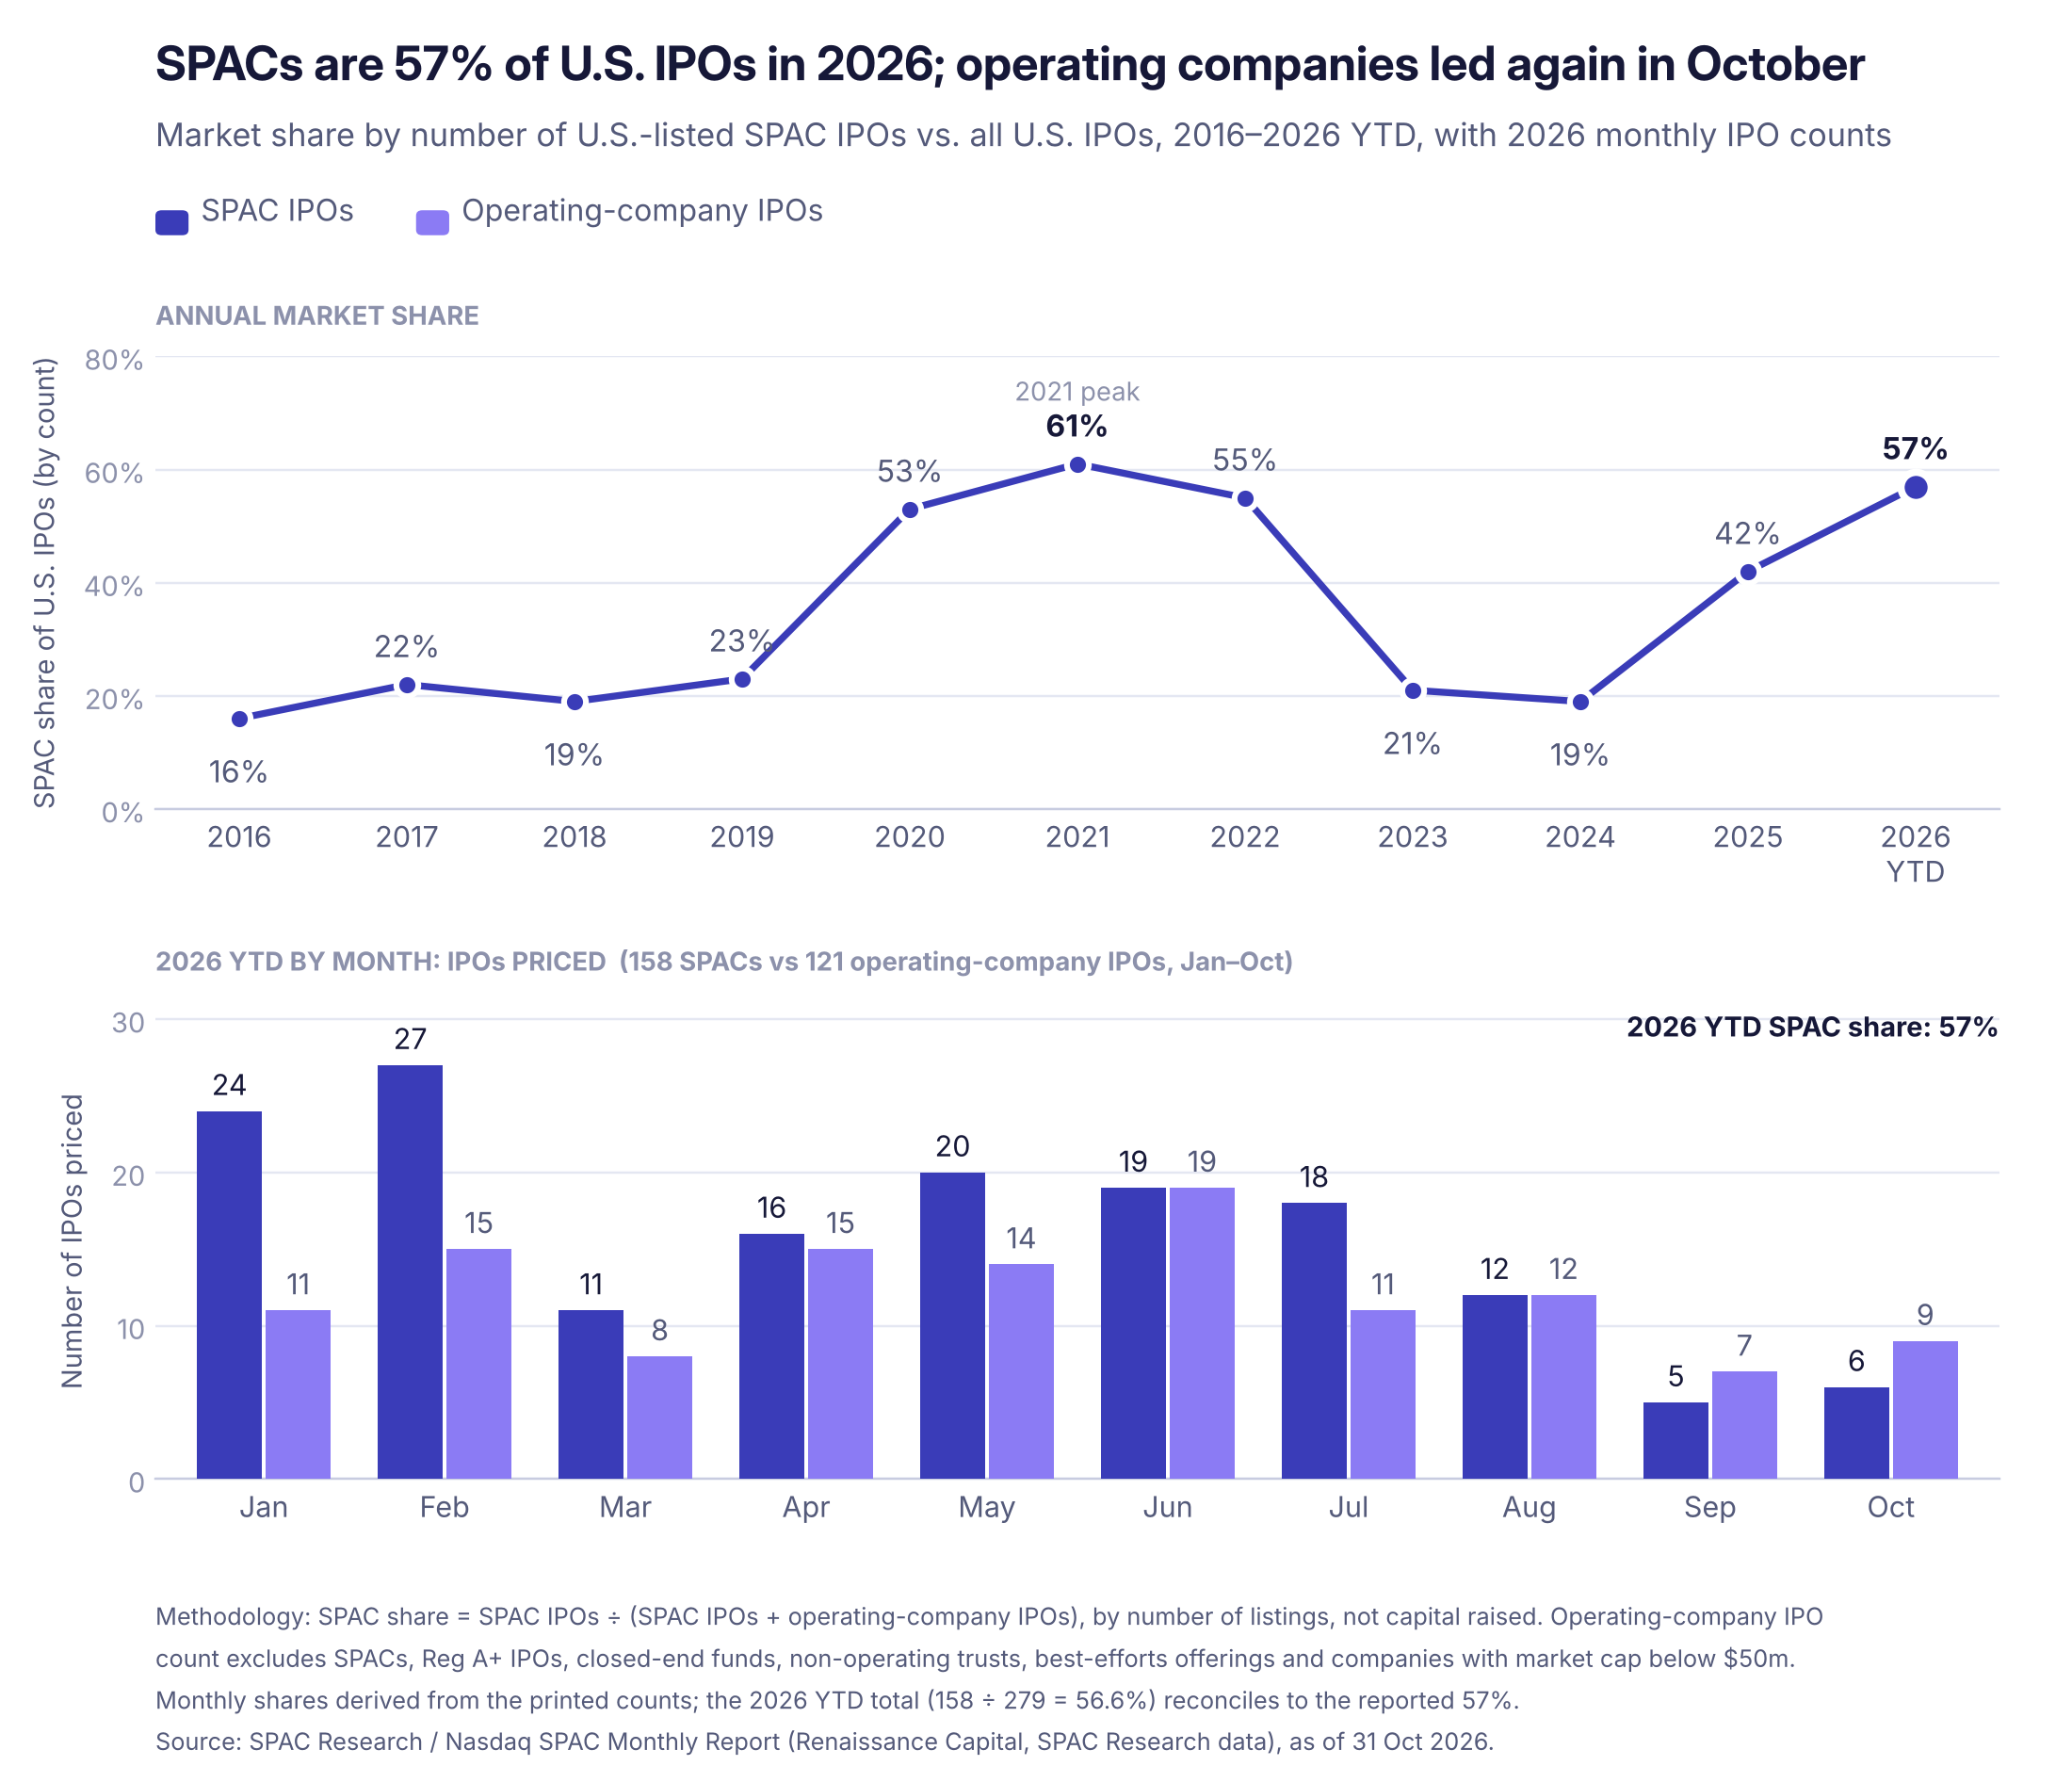
- SPACs remain the majority of U.S. listings, but the lead is narrowing. SPACs were 57% of U.S. IPOs by count in 2026 to 31 Oct (158 SPACs against 121 operating-company IPOs), down from 58% a month earlier but still well above 42% in 2025 and near the 61% peak of 2021.
- Operating companies outnumbered SPACs for a second straight month. 9 operating-company IPOs priced in October against 6 SPACs, a 40% SPAC share, after 7 against 5 in September.
- SPAC issuance has slowed far more than operating-company issuance. SPAC IPOs averaged about 8 a month from August to October against about 19 a month from January to July, a 60% drop; operating-company IPOs fell about 30%, from 13 to 9 a month. Since August, SPACs account for 45% of listings (23 of 51).
- The 57% is a share of listings, not of capital raised. October's six SPACs raised $0.7 billion, about $115 million each, so the SPAC is the most common route to a U.S. listing this year, but not the largest source of new equity.
Fundraising in the USA
A. Private Markets
- PE dealmaking recovered in Q3 but remains below 2025. U.S. PE deal value rose 20.9% q/q to $233.8 billion across an estimated 2,467 deals, but was 30.4% below Q3 2025, and YTD value of $729.8 billion is pacing 13.6% behind last year; buyout value fell 55.1% y/y in Q3. Sponsors are still investing, but in smaller deals, because higher floating-rate debt costs limit how much they can borrow.
- Exit value rose on a handful of large sales. Q3 exit value jumped 50.4% q/q to $165.5 billion across 405 exits; mega-exits account for 73.3% of 2026 exit value, and strategic buyers for nearly 60% of Q3's. PE-backed IPOs have produced $66.0 billion of exit value across 30 listings YTD, with value pacing 38.5% below 2025 even as count paces 25% higher: more listings, but smaller ones.
- Fundraising is concentrating in the largest managers. U.S. PE funds closed 348 vehicles for $222.0 billion through Q3, on course for a third straight annual decline. Funds of $1 billion or more took a record 83.4% of capital, and emerging managers raised $26.5 billion across 122 funds, against $37.4 billion across 237 in all of 2025. Dry powder fell below $1 trillion ($997.6 billion at end-2025) for the first time since 2021, so private capital for mid-sized growth companies is getting scarcer.
B. Public Markets
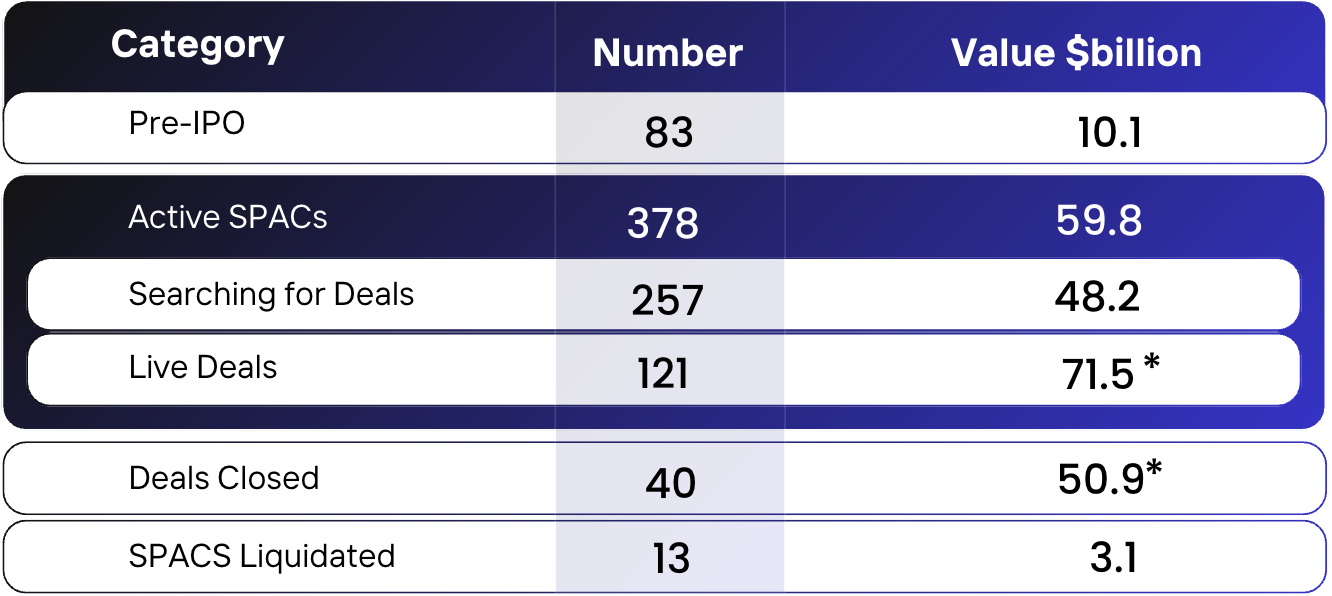
- SPAC IPOs have passed 2025 on both count and proceeds. 158 SPAC IPOs priced in 2026 to 31 Oct, raising about $31 billion, against 144 and about $30 billion in all of 2025; a further 83 vehicles are in registration seeking $10.1 billion (SPAC Research).
- Trust capital is large, but most of it will be redeemed. 378 active SPACs hold $59.8 billion in trust: 257 ($48.2 billion) are still searching, and 121 have live deals carrying $71.5 billion in equity value (SPAC Research, 31 Oct). Announced equity value is not cash a target will receive; at recent redemption rates, nearly all trust cash leaves at closing.
- AI-scale financings led the rest of equity capital markets. In October, Meta's upsized $25 billion common stock offering (priced 27 Oct at $625) made up most of the $28.8 billion raised across 14 follow-ons. Seven traditional IPOs raised $1.1 billion, all of them healthcare companies, led by Lycia Therapeutics' $318 million debut (+63.1% on day one), and 10 PIPEs and registered directs raised $3.2 billion, led by IonQ's $2.0 billion (FactSet, Dealogic, Placement Tracker; SEC-registered deals above $20m). Anthropic has filed publicly for a Nasdaq IPO under "ANT", targeting mid-November.
SPAC Issuance Activity: October 2026
 View full size
 View full size
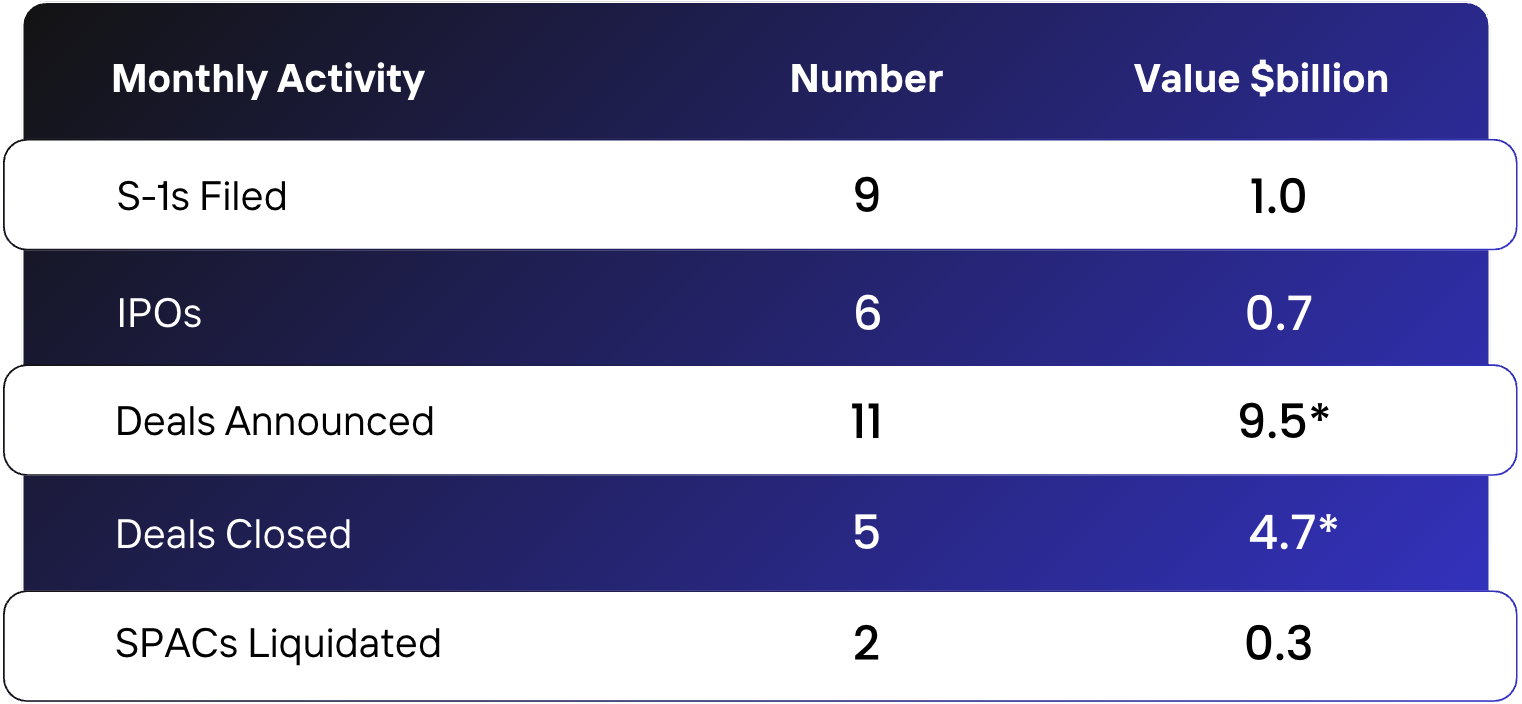
- 6 SPAC IPOs priced for $0.7 billion, the second-lowest monthly count of 2026 after September's 5.
- 9 S-1s were filed for $1.0 billion, about half September's 17; the pre-IPO pipeline stands at 83 vehicles seeking $10.1 billion.
- 11 business combinations were announced for $9.5 billion, bringing live deals to 121 with $71.5 billion in equity value.
- 5 de-SPACs closed for $4.7 billion, bringing 2026 to 40 closings worth $50.9 billion.
- 2 SPACs liquidated, returning $0.3 billion, bringing 2026 to 13 liquidations ($3.1 billion); 257 SPACs holding $48.2 billion remain in search.
Recent De-SPAC Transactions Closed
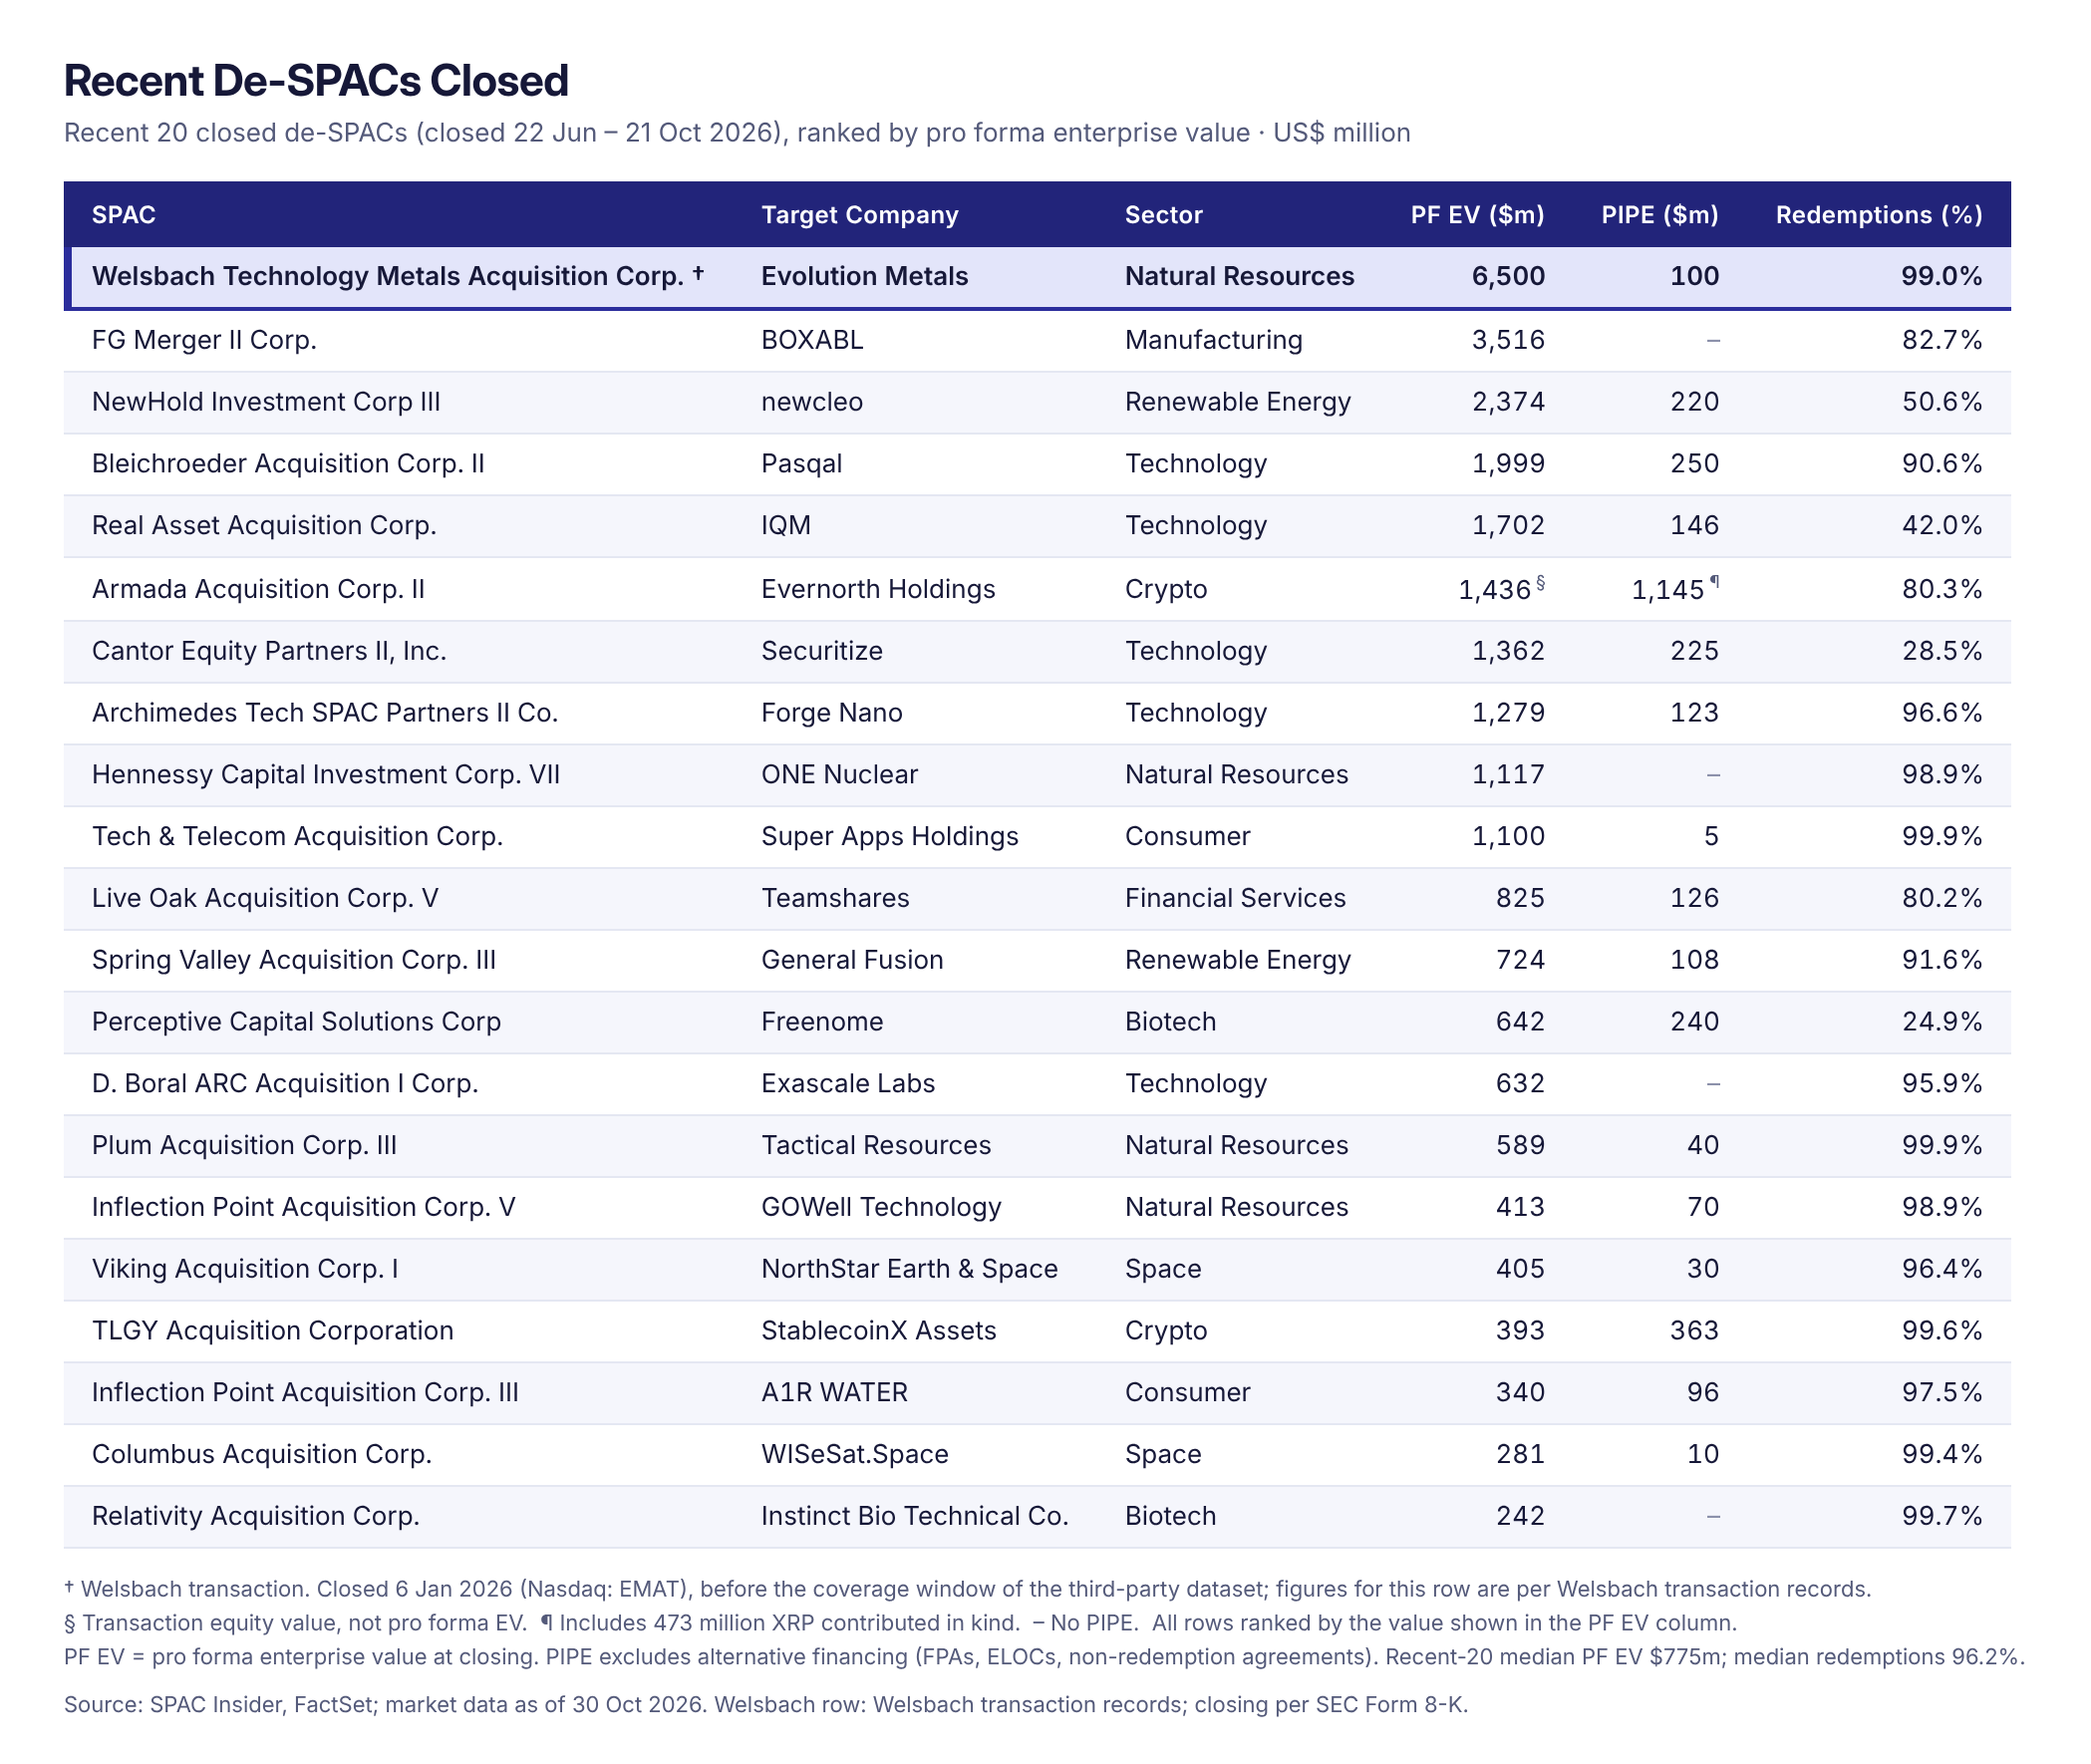
Five de-SPACs closed in October, led by Evernorth Holdings ($1.4 billion equity value) and Forge Nano ($1.3 billion pro forma EV). The table shows the 20 most recent closings, from 22 June to 21 October.
 View full size
- Redemptions remain near-total. Median redemptions were 96.6% for October's five closings and 96.2% across the recent 20 (mean 82.7%); 16 of the 20 exceeded 80%, and only Freenome (24.9%), Securitize (28.5%) and IQM (42.0%) came in below 50%.
- Aftermarket prices fell with the Nasdaq. Only two of the 20 now trade above $10, Evernorth ($14.20) and Freenome ($12.48), down from four a month earlier; the median price is $4.19, and 12 of the 20 trade below $5 (prices as of 30 Oct).
- Committed capital is still what sets deals apart. Evernorth closed with a $1,145 million PIPE, including XRP contributed in kind, and 80.3% redemptions, and it now trades higher than any other deal in the table. The four deals that closed without a PIPE all trade below $3.
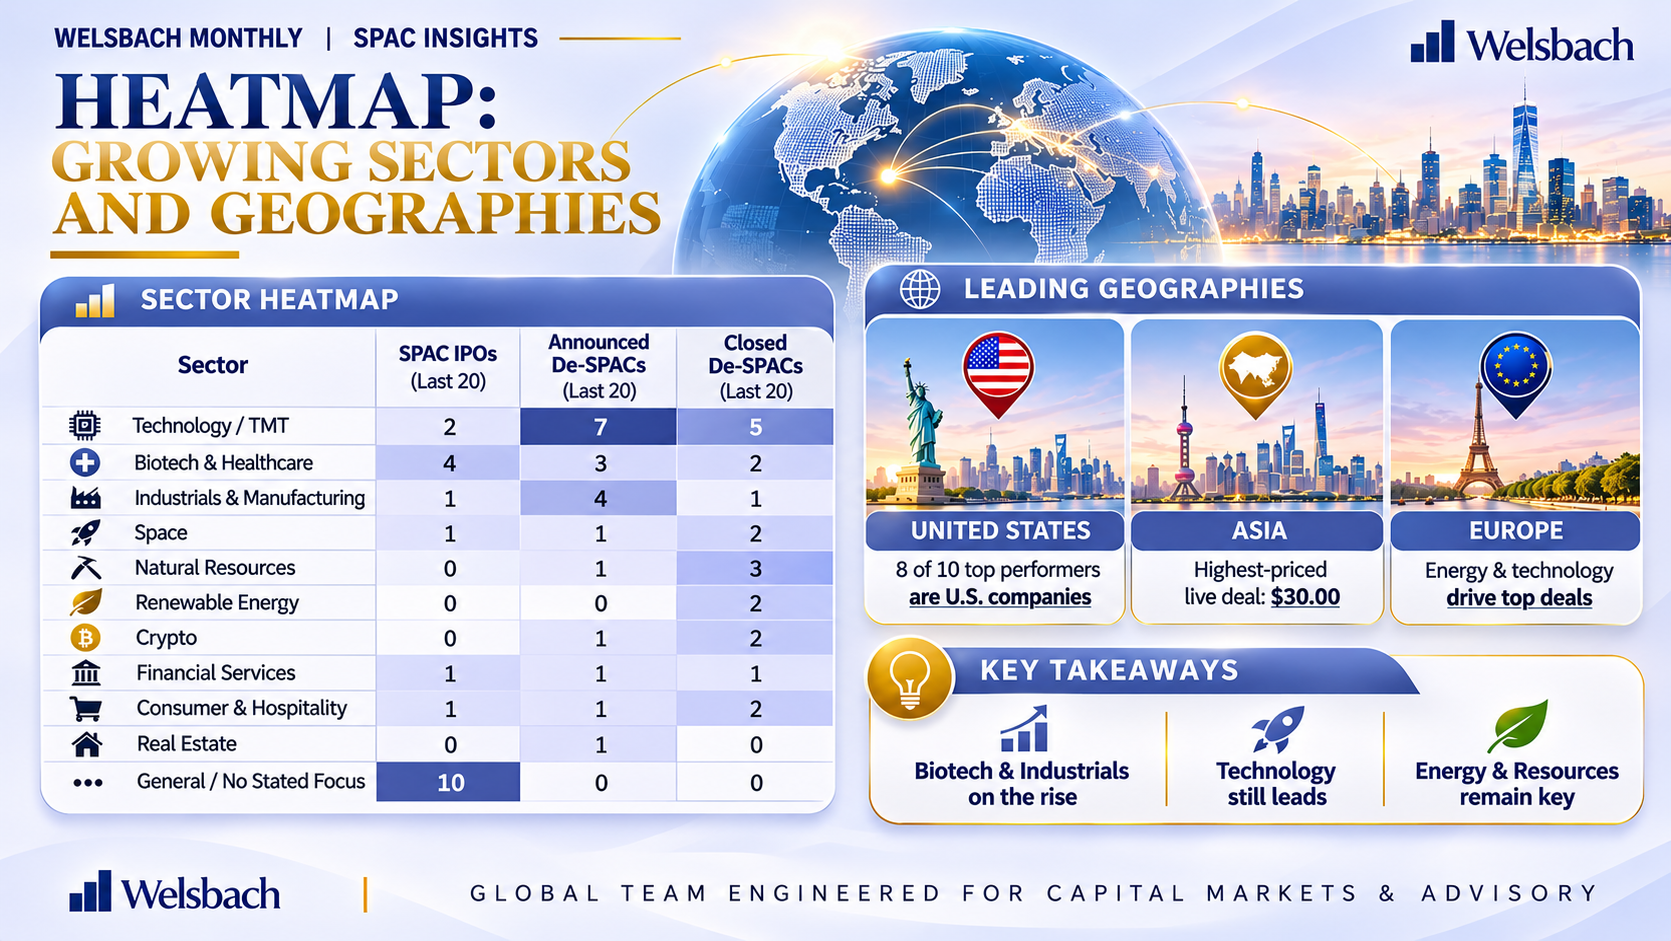
Heatmap: Growing Sectors and Geographies
 View full size
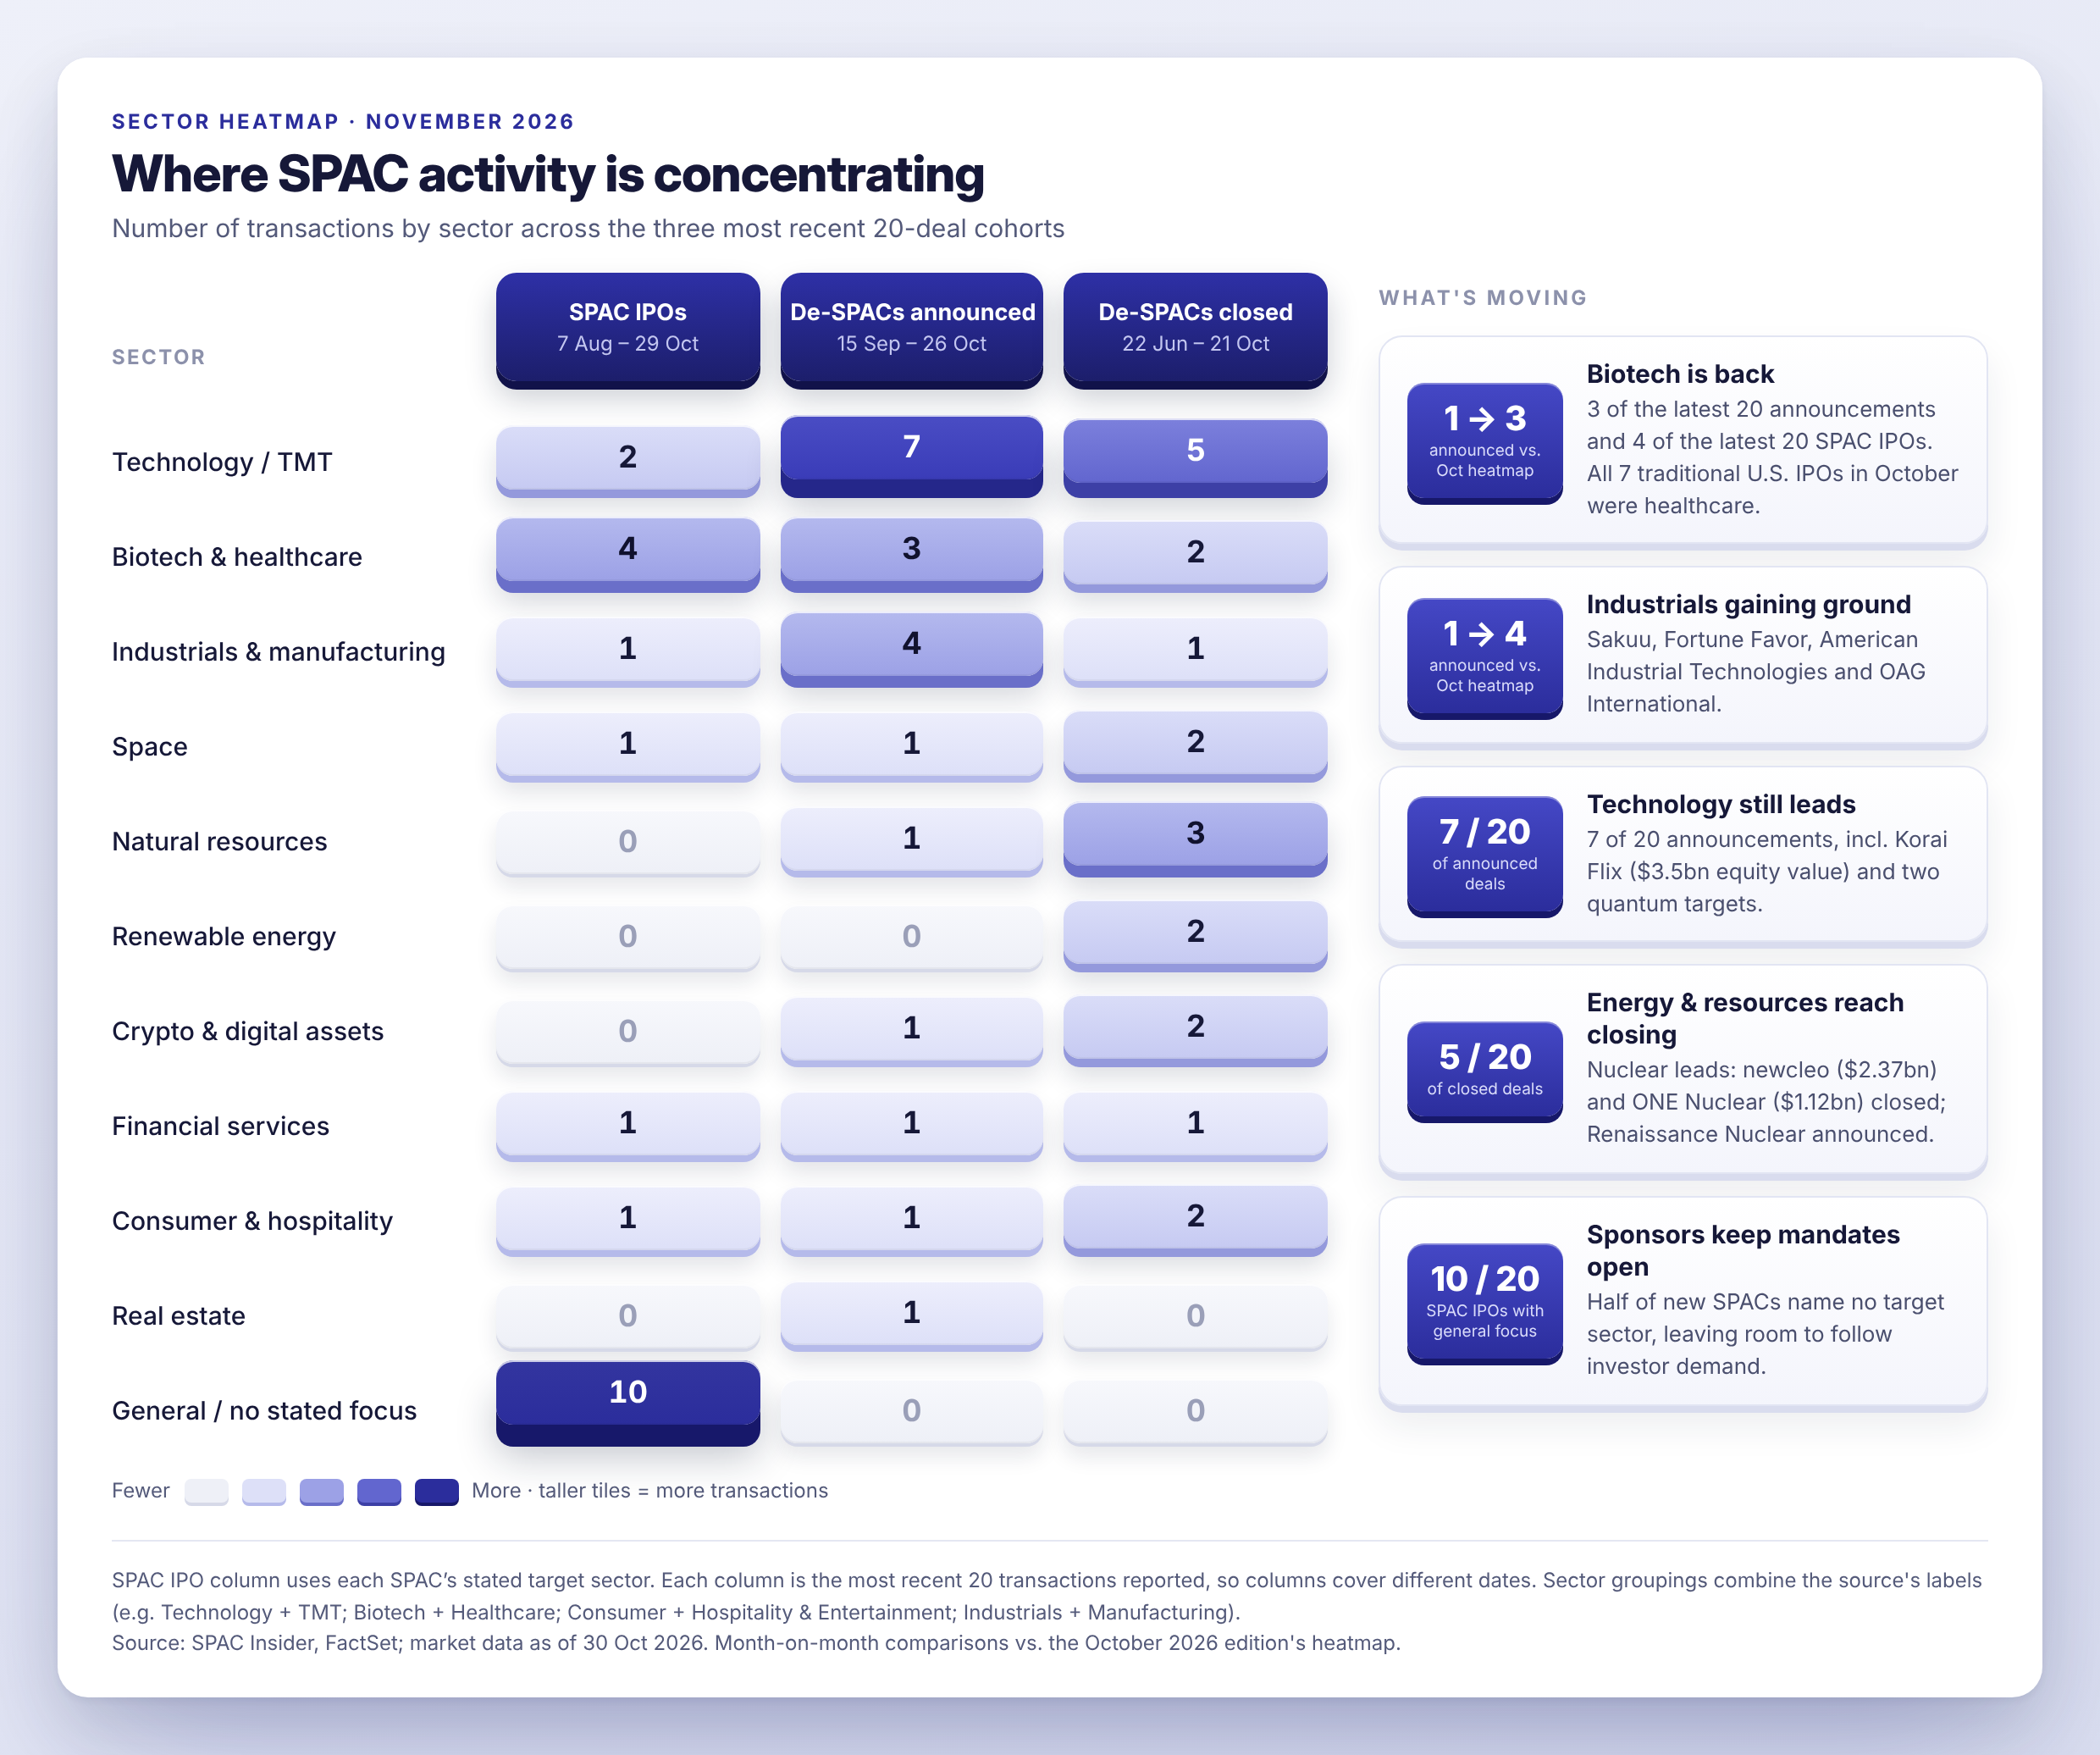
Growing Sectors in SPACs
- Biotech is back. Three of the 20 latest announcements are biotech: Amanat / Corxel US ($228 million PF EV, $300 million PIPE), TCGX / TriGemX Bio ($403 million, $160 million PIPE) and Horizon Space I / ArcheNova Biotech ($2.0 billion equity value). Four of the 20 latest SPAC IPOs also target biotech or healthcare, and all seven traditional U.S. IPOs in October were healthcare companies.
- Industrials are gaining ground. Industrials and manufacturing account for 4 of the 20 latest announcements, up from 1 in last month's heatmap: Pyrophyte II / Sakuu ($682 million), Quantumsphere / Fortune Favor Technology ($600 million), SIM / American Industrial Technologies ($500 million) and Harvard Ave / OAG International ($300 million equity value).
- Technology still leads, with a quantum tilt. 7 of the 20 announcements are technology or TMT, including APEX Tech / Korai Flix ($3.5 billion equity value, the largest) and two quantum targets: GigCapital8 / Quantisimo ($666 million equity value) and Charlton Aria / KQC Quantum ($215 million). They follow the closings of quantum companies IQM and Pasqal earlier this year.
- Nuclear deals keep coming. Digital Asset Acquisition / Renaissance Nuclear ($318 million, $15 million PIPE) adds to the closings of newcleo and ONE Nuclear, which together make up 2 of the 5 energy and resources deals among the last 20 closings.
 View full size
Leading Geographies
- U.S. targets still dominate the 2026 winners, but few trade above $10. 8 of the 10 best-performing 2026 de-SPACs are U.S. companies, led by Evernorth ($14.20) and Horizon Quantum ($14.04); the other two, IQM and Securitize, are global, and only five of the ten trade above $10 (SPAC Research, 31 Oct).
- Asia's highest-priced live deal has cooled. RF Acquisition II / Nanyang Biologics still leads all live deals but now trades at $30.00, down from $37.55 a month earlier; Healthcare AI / Leading Group ($573 million equity value) is the other Asian target in the top ten.
- Europe's leading live deals are in energy and technology. ClimateRock / GreenRock ($475 million equity value, energy) and Cartesian Growth II / InoBat (technology) are in the top ten live deals; global targets Sio Silica, Embed Financial and ArcheNova Biotech take three more places. Geography data covers only the top 10 by share price, so it shows where performance is concentrated rather than where deal volume is.
What If Your ECM Team Had an AI Team Working Alongside It?
Equity Capital Markets involves a constant flow of research, issuance signals, pricing analysis, prospectus preparation, and investor demand tracking. Each requires different expertise, and bringing all that information together takes time.
What if these activities could be supported by a team of specialised AI agents?
With Brexy's ECM Capital Markets AI Agent Team, different agents take on different parts of the workflow:
- ECM Lead: Coordinates issuance-related workflows and pricing signals.
- Equity Markets Analyst: Tracks comparable pricings, aftermarket activity, and investor targeting.
- Prospectus Drafter: Supports prospectus drafting, risk factors, and use-of-proceeds sections.
- Syndicate Analyst: Supports order-book analysis, allocation, and demand assessment.
Rather than relying on one general-purpose AI assistant, the idea is to bring specialised agents together, each with a defined role, working towards a shared objective.
The banker remains in control, reviewing the work and deciding what moves forward.
This is one example of how Brexy is bringing agent teams into capital markets workflows.
Watch the ECM Agent Team in action below.
Ready to experience agentic AI for yourself?
Join the Brexy Agent Studio and Enjoy 1 Month Free. Build your agents. Bring them together. Rethink how work gets done.
Join Brexy Agent Studio - 1 Month Free
See the ECM Capital Markets AI Agent Team guide
Conclusion
October showed a slower, more selective SPAC market rather than a reversal. SPACs still make up 57% of U.S. listings in 2026, issuance has passed 2025 on both count and proceeds, and the live pipeline grew to 121 deals with $71.5 billion in equity value. But operating companies have now out-listed SPACs for two months, only two of the 20 latest de-SPACs trade above $10, and the Nasdaq correction, sticky inflation and a likely December hike narrow the window for growth-stage issuers. The targets closing on terms that hold up are the ones arriving with audited financials, committed PIPE capital and a credible path to profitability, not those relying on trust cash.
Exploring growth capital or a U.S. listing? Partner with the Welsbach team to make it happen. Reach Us: Click Here
- Website: https://welsbach.group/
- Contact Us: Click Here
- Email: contact@welsbach.sg
Disclaimer: SPACtacular reflects the personal views and opinions of its author at the date of publication. It is written for general information and discussion only. Nothing in this newsletter constitutes investment, financial, legal, tax or accounting advice. It is not a recommendation, solicitation or offer to buy, sell or hold any shares, securities or other financial instruments, and it should not be relied upon as the basis for any investment decision. Readers should seek independent professional advice suited to their own circumstances before acting on anything discussed here. The content draws on sources believed to be reliable, but no representation or warranty is given as to its accuracy, completeness or timeliness. Opinions and statements about future events may change without notice and may prove to be wrong. Past performance is not a guide to future results. The author and Welsbach Group may hold positions in, advise, or have commercial relationships with companies, sponsors or transactions mentioned in this newsletter. References to any company or transaction do not imply endorsement. The appearance of a sponsor does not mean that sponsor has reviewed, approved or endorsed any content, and the views expressed are not those of any sponsor. Neither the author nor Welsbach Group accepts any liability for any loss arising from the use of this newsletter or its contents.
Download
Take this edition with you
Register once to download this Welsbach Monthly edition as a branded PDF, including all charts and exhibits.