

SPACs captured 61% of all US IPO market share by count through April 2026, matching the 2021 peak, while a weaponized Strait of Hormuz and an 8-4 Fed split left policy frozen.
Originally published on Welsbach SPACtacular Monthly Insights (Substack)
We spend hours researching and talking to the smartest founders, dealmakers and investors in the SPAC landscape. This is our attempt to give you a short 5-10 minute summary on how we are thinking about the macro, markets and SPACs, and what lies ahead. Hundreds of hours summarized, so you don't have to.
Quick Macro TL;DR
Ceasefire in name only. By early May, the Strait of Hormuz had turned into an active combat zone with US-Iran exchanges, drones and missile strikes, setting the UAE's Fujairah terminal ablaze and driving Brent Crude above $112 (vs. $61 at the start of the year).
Against this backdrop, the Fed is effectively frozen: April's hold at 3.5%-3.75% came with an 8-4 split, the most fractured since 1992, as hawks dig in on energy-led inflation and doves flag a weakening labor market.
Enter Kevin Warsh, clearing a historic partisan confirmation and signaling a regime shift, scrapping the dot plot and backing preemptive cuts on an AI-driven disinflation thesis. Yet markets aren't buying it, pricing a prolonged hold amid stubborn inflation and elevated oil. Net: a weaponized oil artery, a divided Fed mid-transition, and policy paralysis at precisely the wrong time.
The Good
- Markets roared back with the S&P and Nasdaq at all-time highs. The S&P 500 surged 13% from late-March lows to a record 7,230, with the Nasdaq hitting 25,114, the sharpest rally since April 2020, fuelled by blowout earnings and ceasefire optimism.
- Corporate earnings are delivering, emphatically. 84% of S&P 500 companies beat Q1 estimates, the highest rate since Q2 2021, coming in 20.7% above expectations. Communication Services and IT led with 53% and 50% earnings growth respectively, fuelled by the AI supercycle.
- Labor market holds firm and jobless claims hit a 57-year low. Initial claims fell to 189k, the lowest since 1969, with continuing claims at a two-year low. Companies are holding onto workers even as macro uncertainty mounts.
The Bad
- Gold's safe-haven fade. Gold plunged 5% in early May amid US-Iran escalations, dollar strength and persistent inflation fears, down to roughly $4,553/oz, eroding its regime hedge status.
- Fed dissent highlights policy strain. The highest internal split since 1992 at the April meeting, a dot plot showing just one 2026 cut amid elevated inflation, and Powell succession adds uncertainty.
- The Yen's warning signal. The Japanese Yen collapsed to 160/dollar in late April, forcing suspected BOJ intervention. A rampant dollar is tightening financial conditions globally, squeezing emerging markets and multinationals on debt and operations alike.
SPACs Regain Leadership: Market Share Peaks as Issuance and Pipeline Strengthen
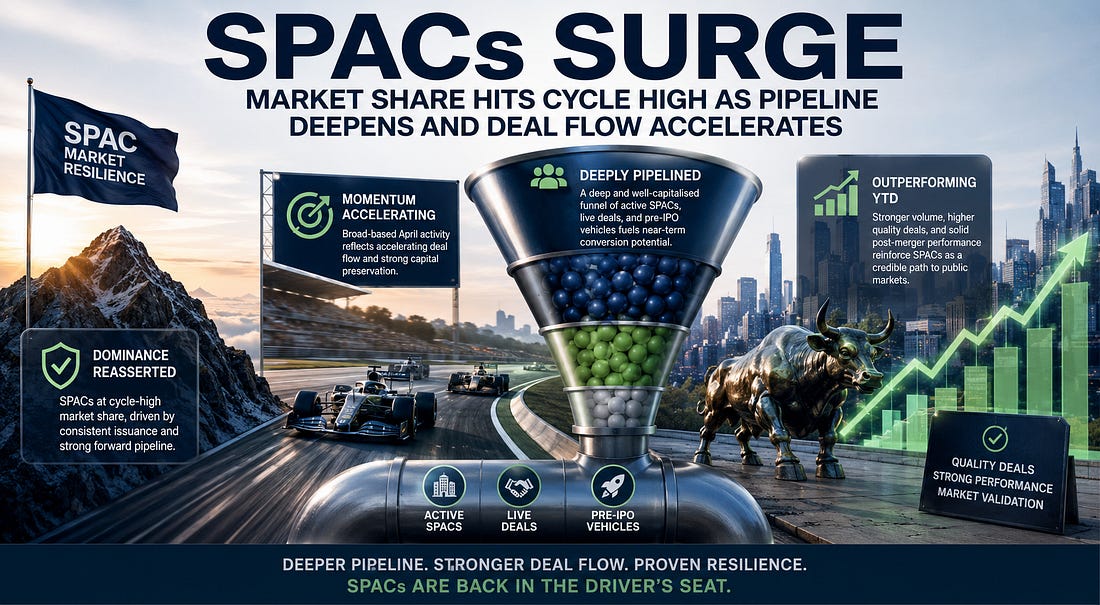
- SPAC dominance reasserts itself. SPACs captured 61% of all US IPO market share by count through April 2026, matching the 2021 peak, driven by consistent monthly issuance, with 16 SPAC IPOs priced in April alone raising $2.8 billion, and 17 S-1s filed signalling a strong forward issuance runway.
- April activity reflects broad-based momentum. Monthly deal activity included 8 deals announced at $3.8 billion equity value and 1 deal closed at $0.8 billion, with zero SPACs liquidated, underscoring both accelerating deal formation and improved capital preservation.
- Pipeline signals substantial near-term conversion potential. As of April 30, 2026, the market hosts 352 active SPACs ($54.4 billion), including 111 live deals representing $62.2 billion in equity value, alongside 75 pre-IPO vehicles ($9.4 billion).
- 2026 year-to-date outperforms on both volume and value. SPAC IPO issuance stands at 80 priced with 75 pending, and 11 deals have already closed ($16.9 billion EV) against just 2 liquidations ($0.6 billion), while the top closed deal, Xanadu (XNDU), trades at $29.19.
Fundraising in the USA
Private Markets: Growth Equity Engine Stalls Amid Liquidity Crunch
- Fundraising momentum weakens sharply. US growth equity stands at $14.9B in 2026 YTD vs. $51.6B in 2025 (-71% YoY), with fund count down from 77 to 17 (-78% YoY).
- Post-peak normalization continues. After peaking at $102.6B (172 funds) in 2021, fundraising has trended -43% (2022), +10% (2023), -9% (2024), -13% (2025), indicating a sustained downcycle.
- Reverting to historical levels. Despite scaling from $10.3B (2009) to $102.6B (2021), the 2026 run-rate signals a reset toward pre-2013 levels, driven by LP overallocation and weak distributions.
Public Markets: SPAC Engine Hits Multi-Year Peak
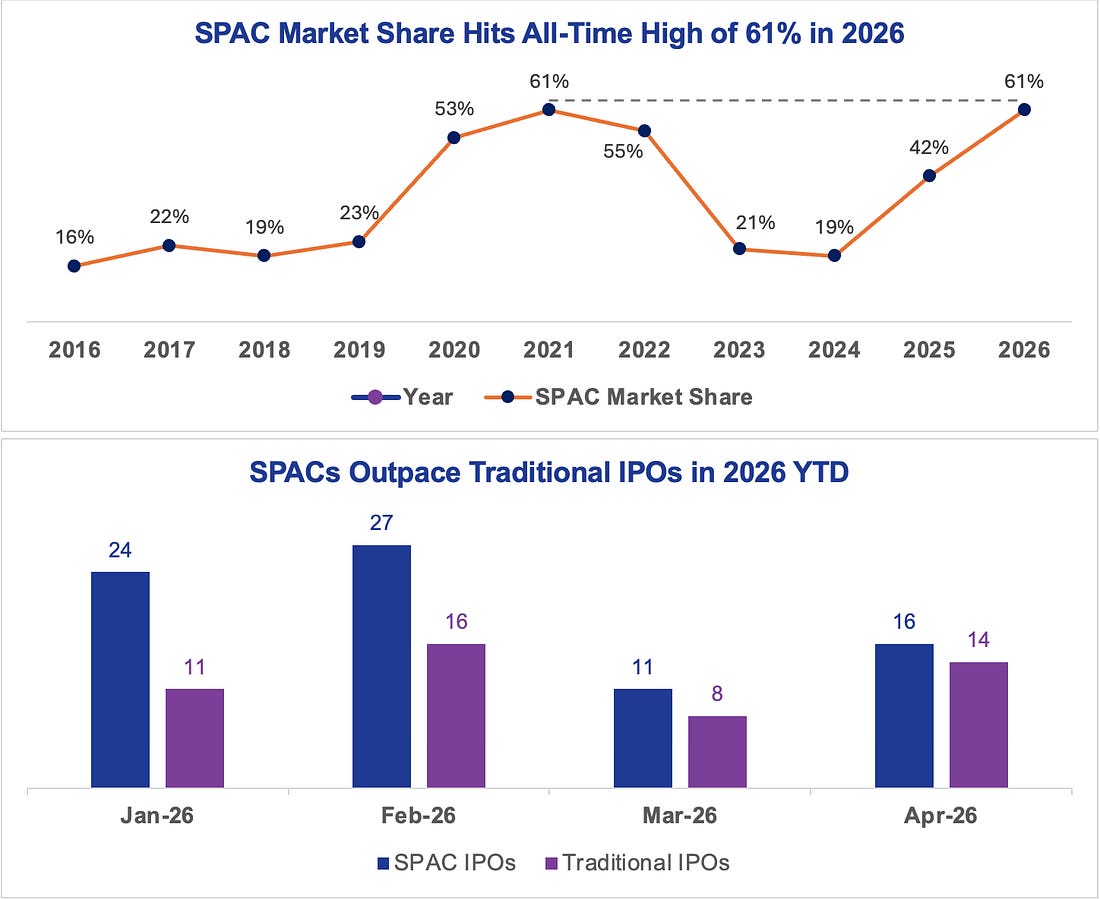
- US IPO market YTD (Jan-Apr 2026): 127 total IPOs priced (78 SPACs plus 49 traditional).
- SPAC issuance surged to $11.8B in Q1 2026, up from just $3.0B in Q1 2025, a near fourfold increase that pushed SPAC activity back to its 2021 peak levels.
SPAC Engine in Full Throttle
- Dominance: SPACs account for 61% of all US IPOs by count in 2026, matching the 2021 all-time peak, up sharply from 19% in 2024 and 42% in 2025.
- April activity: 16 SPAC IPOs priced ($2.8B) alongside 14 traditional IPOs, with 17 new S-1 filings adding $3.0B to the forward pipeline.
- Deal flow: 8 new deals announced ($3.8B EV) and 1 deal closed ($0.8B EV) in April, with zero SPAC liquidations.
- YTD issuance: 80 SPAC IPOs priced ($16B) with 75 pending ($9B); the total 2026 SPAC IPO pipeline stands at 155 vehicles ($25B).
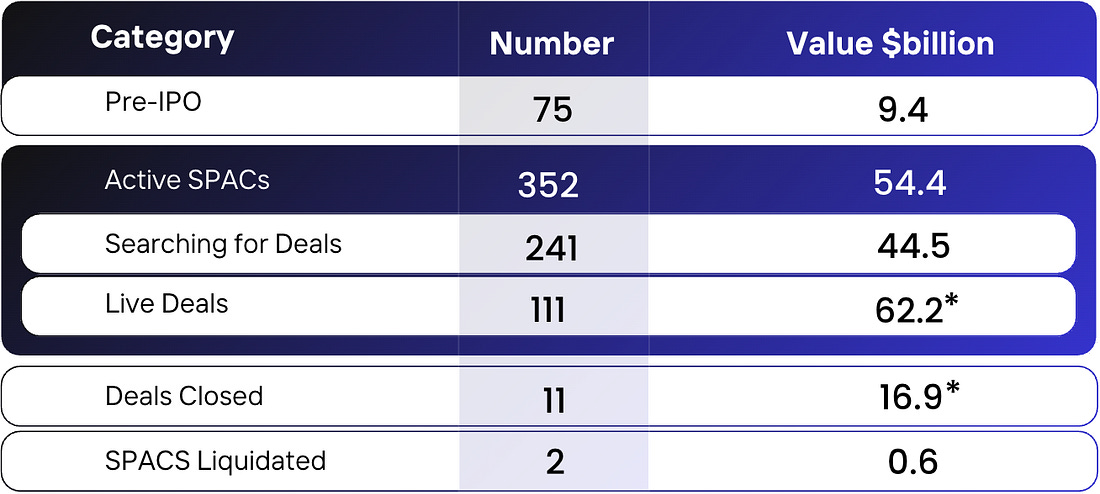
- Dry powder: 352 active SPACs hold $54.4B in trust capital.
- Hunting mode: 241 SPACs actively searching for targets, representing $44.5B in deployable capital.
- Live deals: 111 announced but unclosed deals represent $62.2B in equity value, the deepest live pipeline since 2022.
- Closed YTD: 11 deals closed at $16.9B EV with only 2 liquidations ($0.6B), the strongest conversion ratio since 2021.
- IPO pipeline: 75 pre-IPO SPACs queued, potentially adding $9.4B to the market.
SPAC IPOs (Apr'26)
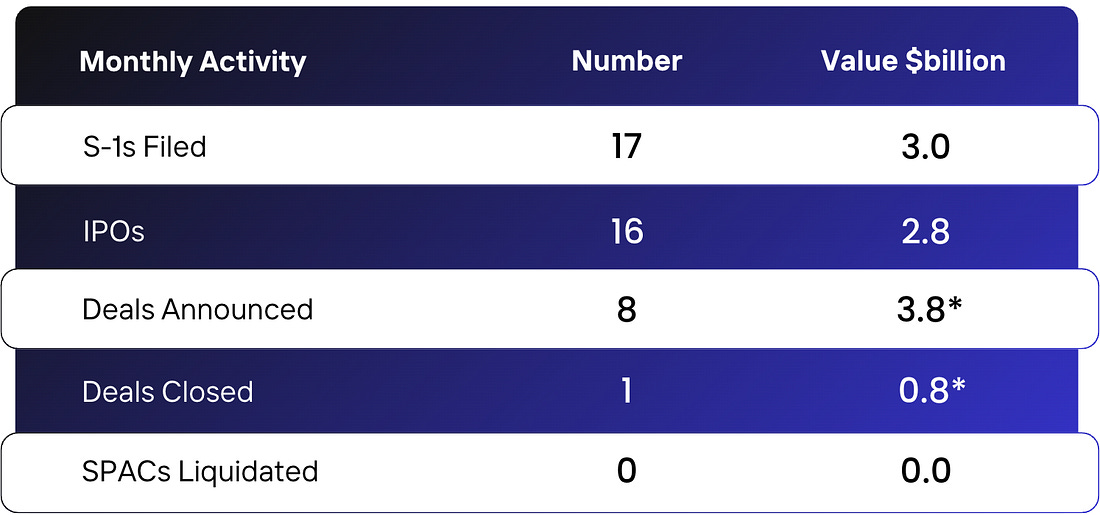
- April activity: issuance held firm with 16 SPAC IPOs pricing during the month, raising $2.8 billion in capital, supported by 17 S-1 filings worth $3.0 billion.
- Deal mix: 8 new merger announcements totalling $3.8 billion in equity value, though deal closings slowed to just 1 transaction worth $0.8 billion; notably, zero SPACs were liquidated.
- Largest transactions: 111 live deals carry a combined equity value of roughly $62.2 billion; standout pending combinations include United Hydrogen Group (roughly $1.6 billion EV) and VERAXA Biotech (roughly $1.6 billion EV), spanning Energy and Healthcare across Asia and Europe respectively.
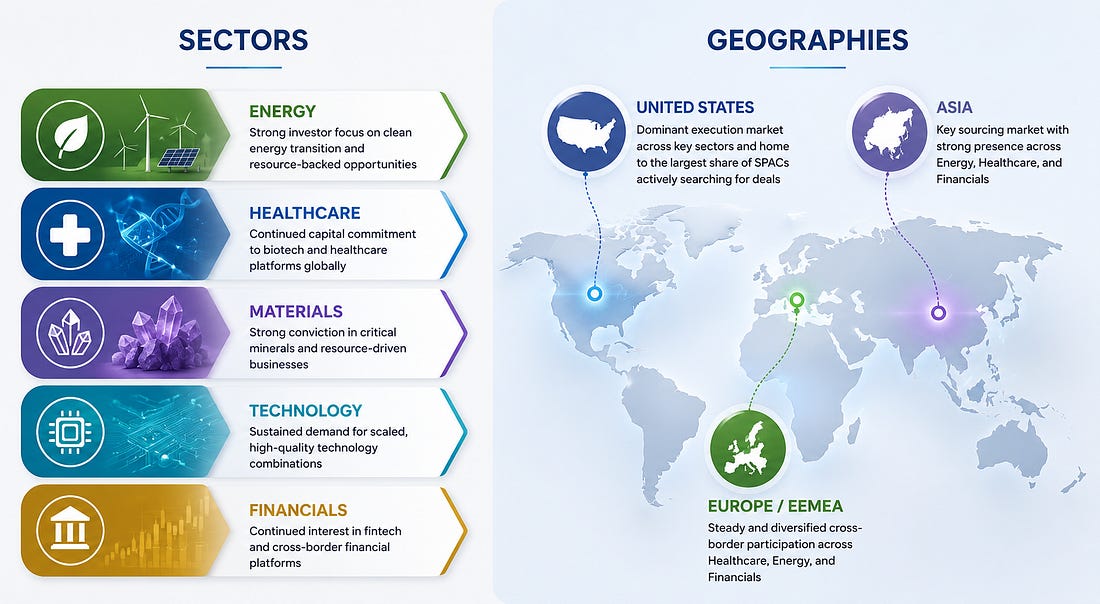
Heatmap: Growing Sectors and Geographies
Growing sectors in SPACs
- Energy leads activity with 3 of the top 10 live SPAC deals, including United Hydrogen Group (roughly $1.6 billion EV, Asia) and GreenRock (roughly $475 million EV, Europe), alongside closed 2026 deals in Presidio Petroleum and Eagle Energy Metals.
- Healthcare accounts for 2 of the top 10 live deals, represented by CUBEBIO (roughly $375 million EV, Asia) and VERAXA Biotech (roughly $1.6 billion EV, Europe).
- Materials contributes 2 of the top 10 live deals via US Elemental (roughly $586 million EV) and Sio Silica Corporation (roughly $758 million EV), complemented by the landmark closed transaction in Evolution Metals (roughly $5.9 billion EV via Welsbach Technology Metals).
- Technology represents 1 of the top 10 live deals (Boost Run, roughly $614 million EV) while dominating the 2026 closed deals leaderboard with Xanadu (roughly $3.6 billion EV), Infleqtion (roughly $1.8 billion EV) and Horizon Quantum (roughly $644 million EV).
- Financials appear across 2 of the top 10 live deals, including Leading Group (Asia), alongside CoinShares (roughly $1.5 billion EV) in closed deals.
Leading geographies
- United States: overwhelmingly the dominant execution market, accounting for the majority of 2026 closed transactions across Technology, Energy and Industrial sectors, and hosting the largest share of SPACs actively searching for deals (241 vehicles holding roughly $44.5 billion).
- Asia: features prominently across live deals in Energy, Healthcare and Financials, with three of the top 10 live transactions targeting Asian businesses.
- Europe / EEMEA: represented across live and closed deals in Healthcare (VERAXA Biotech), Energy (GreenRock) and Financials (CoinShares, Europe; Gadfin, EEMEA).
Conclusion
The April 2026 SPAC data signals a market that has moved to full expansion mode. SPACs have reclaimed a 61% share of all US listings, matching the 2021 peak and confirming that prior highs are no longer a ceiling but a launchpad. The YTD pipeline remains deep, with 352 active SPACs holding over $54 billion and 111 live deals representing $62 billion in pending equity value. Monthly issuance has stabilised at elevated levels, deal announcements continue to accumulate, and the complete absence of liquidations in April underscores robust sponsor conviction. With 75 SPACs still in pre-IPO stage and a broadening sector and geographic mix spanning Technology, Energy, Materials and Healthcare across the US, Asia and Europe, the structural conditions are the foundation of a market operating at all-time highs and building momentum into the second half of 2026.
Download
Take this edition with you
Register once to download this Welsbach Monthly edition as a branded PDF, including all charts and exhibits.