SPACs captured 61% of all U.S. IPOs through May 2026, matching the 2021 peak, with 352 active vehicles holding $55.6 billion in trust and 107 live deals worth $69.6 billion. Our monthly read on macro, markets and SPACs.
Originally published on Welsbach SPACtacular Insights (Substack)
We spend hours researching and talking to the smartest founders, dealmakers and investors in the SPAC landscape. This is our attempt to give you a short summary of how we are thinking about the macro, markets and SPACs, and what lies ahead.
Quick Macro TL;DR
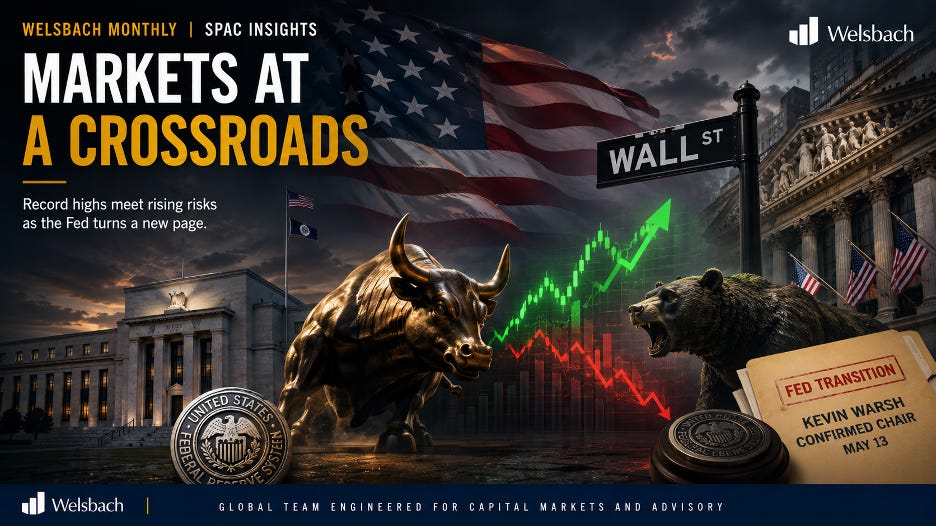
From May through early June, markets were pulled between a powerful AI-led rally that pushed the S&P 500 above 7,600 for the first time and a deteriorating macro backdrop. Inflation accelerated, with April CPI posting its hottest reading since May 2023 amid elevated energy prices linked to the Iran conflict and Strait of Hormuz disruptions.
Uncertainty increased further after Kevin Warsh narrowly secured confirmation as Fed Chair on May 13, inheriting a re-accelerating inflation environment. A surprisingly strong May jobs report then triggered a sharp repricing of rate expectations, driving Treasury yields higher and causing the market's steepest one-day decline in roughly eight months, leaving investors cautious ahead of Warsh's first FOMC meeting on June 16-17.
The Good
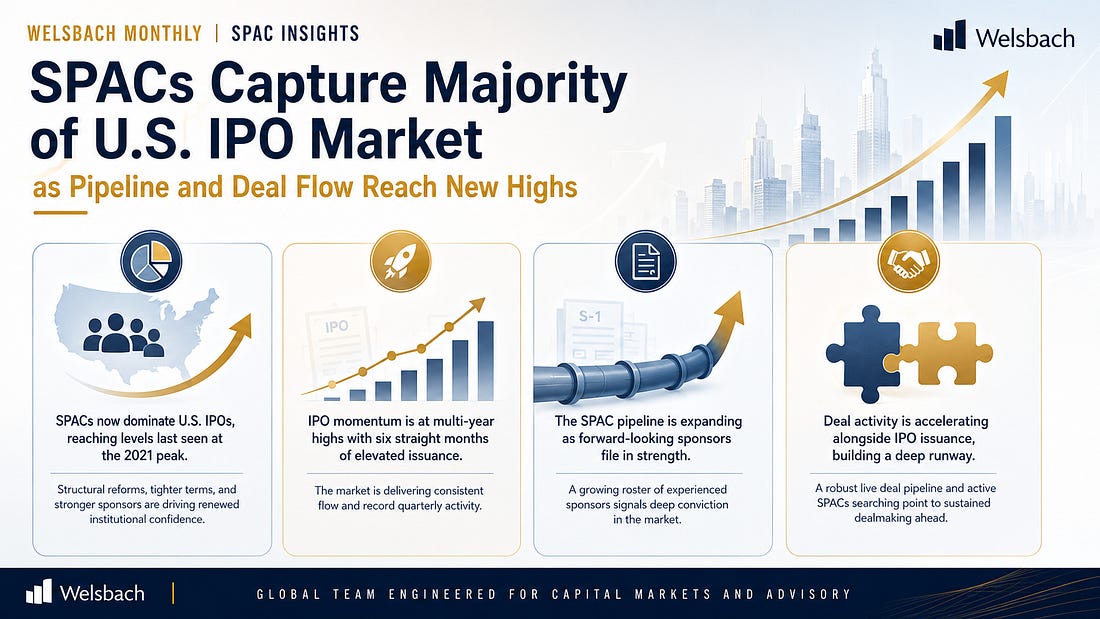
- The S&P 500 breached 7,600 for the first time on a nine-day winning streak. On June 2 the index closed at 7,609.78, with the Dow at 51,307.79 and the Nasdaq at 27,093.90, all three at all-time highs and the longest S&P streak since May 2025.
- Q1 2026 earnings delivered one of the strongest beat rates in years. Of roughly 440 S&P 500 companies reporting through mid-May, 83% exceeded consensus, and full-year 2026 EPS growth projections were revised up to 28.6% from 14.4% in April, concentrated in technology, semiconductors and AI infrastructure.
- Oil retreated nearly 17% in May as Iran ceasefire negotiations advanced, the steepest monthly decline since April 2025, on a 60-day memorandum extending the ceasefire and a framework to de-mine the Strait of Hormuz.
- The May jobs report came in at more than double consensus. Nonfarm payrolls rose 172,000 against expectations of roughly 80,000, affirming labor market resilience despite energy-driven inflation and elevated rates.
The Bad
- The Nasdaq fell 4.18% on June 5 in its worst single session since April 2025, with the VIX spiking nearly 40%, a reminder that concentration risk in AI names is real.
- April CPI printed 3.8% year-over-year, the highest since May 2023, as the Iran war shock flowed into gasoline and fuel oil. CME FedWatch pricing shifted to virtually no probability of a 2026 cut and growing odds of a hike by early 2027.
- Treasury yields surged to multi-month highs, with the 30-year briefly topping 5.1% on May 15 and the 10-year reaching 4.60%, before the strong jobs print pushed the 10-year to 4.55% and the 2-year to 4.17% on June 5.
- Kevin Warsh was confirmed as Fed Chair 54-45, the closest margin for a Fed chair in modern history, raising questions about central bank independence ahead of his first FOMC meeting.
SPACs Capture Majority of U.S. IPO Market as Pipeline and Deal Flow Reach New Highs
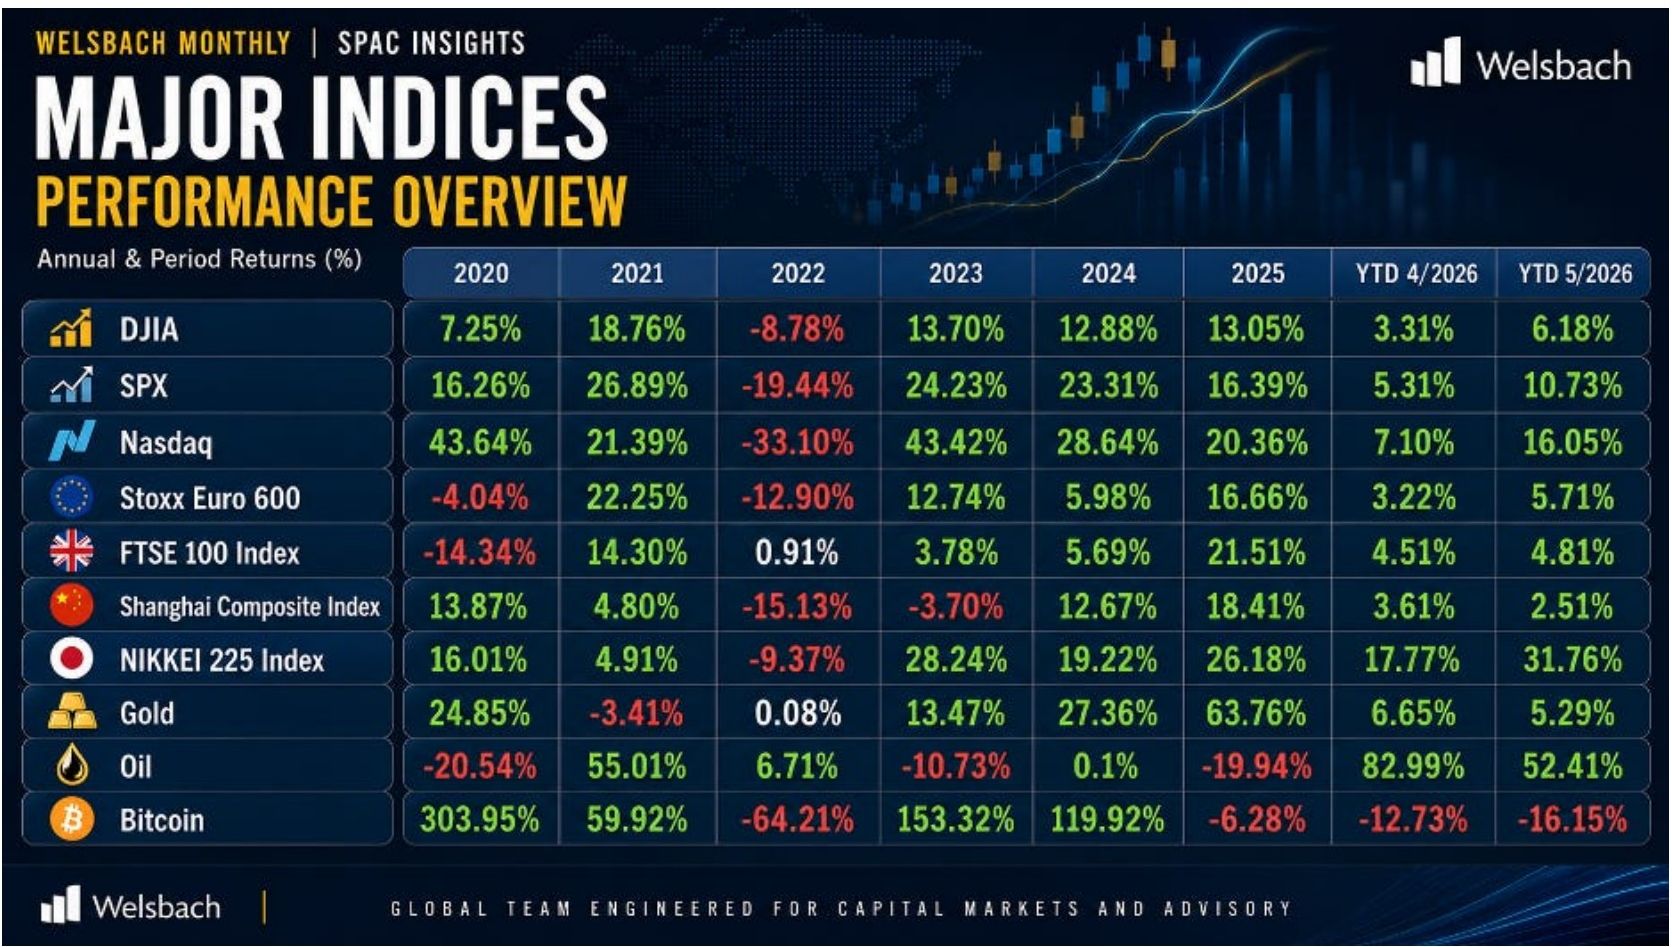
- SPACs captured 61% of all U.S. IPOs by count through May 2026, matching the 2021 peak and up sharply from 42% in 2025 and 19% in 2024. The recovery is structural, not cyclical: reformed unit structures, tighter trust terms and improved sponsor credibility are attracting institutional capital.
- 98 SPAC IPOs have priced year-to-date for $19.1 billion in gross proceeds, with Q1 2026 delivering 62 IPOs for $13 billion alone. May added 20 priced IPOs for $2.9 billion after 16 in April for $3.2 billion, a sixth consecutive elevated month.
- S-1 filings indicate the pipeline is building. 73 SPACs filed S-1s in 2026 for $13.0 billion, including 15 in May for $2.6 billion, led by repeat sponsors such as Cantor Equity Partners VII, Columbus Circle Capital Corp III and Freedom Metals Acquisition Corp.
- De-SPAC conversion is accelerating in parallel. Eight combinations were announced in May for $11.5 billion of enterprise value, and 15 deals have closed year-to-date for $20.1 billion.
Fundraising in the USA
Private Markets: Recovery Remains Uneven as LP Capital Concentrates
- Manager selection remains highly concentrated. The 10 largest funds accounted for roughly 64% of total capital raised in Q1 2026, underscoring LP preference for scaled, established managers.
- Fund count remains well below historical norms. The 108 funds closed in Q1 2026 sit significantly below peak fundraising periods, reflecting continued challenges for first-time and mid-market sponsors.
- Scale is winning the fundraising race. Average capital raised per fund increased to roughly $1.4 billion in Q1 2026 from $1.1 billion in Q4 2025.
Public Markets: Capital Raising Momentum Accelerates
- Traditional IPOs surged. May was the strongest IPO month of 2026, with 12 deals raising $12.8 billion led by Cerebras' $6.4 billion offering. Through Q2, 26 IPOs have raised $27 billion with median post-IPO performance of +11.1%.
- SPACs reclaimed relevance. SPAC IPOs have raised $19.1 billion across 98 deals YTD, with trust values holding at $10.05 and average tenor at 17 months.
- Follow-ons remain the workhorse. 48 follow-ons raised $23.5 billion in May alone, generating 18.4% YTD returns versus negative returns in 2025, amid 9.4% average file-to-offer discounts.
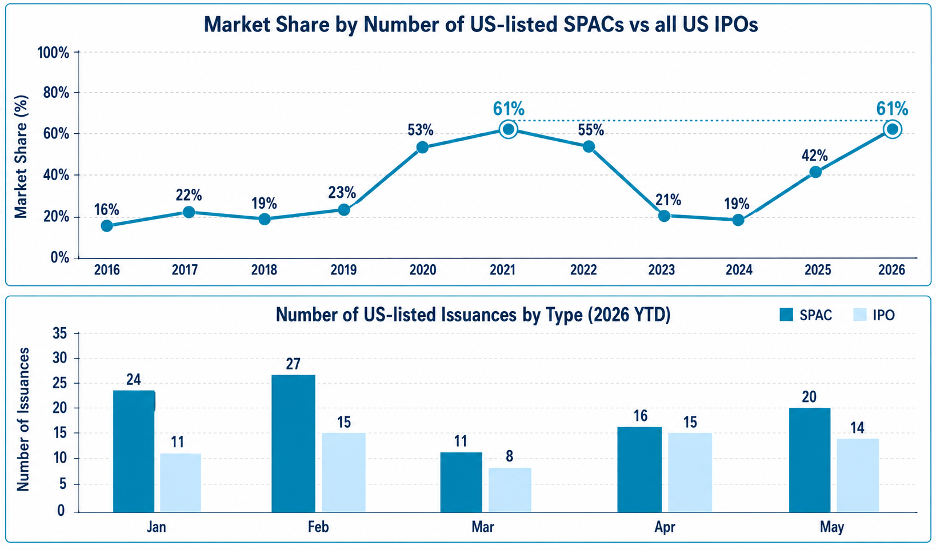
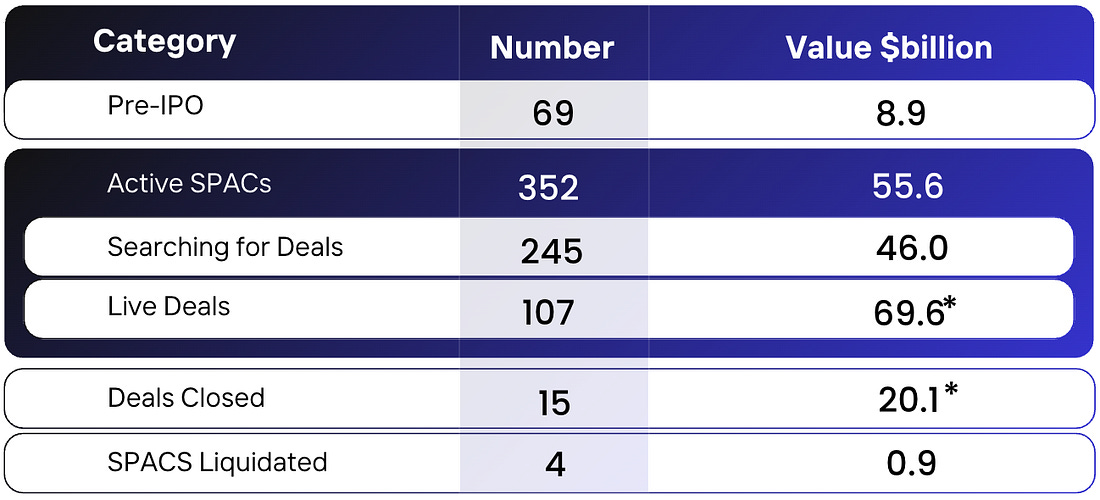
SPAC Engine in Full Throttle: Robust Issuance Meets Deep Deal Pipeline
- Market share at a cycle high: SPACs accounted for 61% of all U.S. IPOs by count through May 2026, matching the record set during the 2021 boom.
- Record capital base: 352 active SPACs hold $55.6 billion in trust, providing substantial acquisition firepower.
- Search capital remains elevated: 245 vehicles are actively searching for targets, representing roughly $46.0 billion of deployable capital.
- Deepest live deal pipeline since 2022: 107 announced but unclosed transactions represent $69.6 billion in aggregate equity value.
- Strong conversion environment: 15 mergers have closed YTD for $20.1 billion while only 4 SPACs liquidated for $0.9 billion.
- Forward IPO pipeline: an additional 69 SPACs are in registration, representing $8.9 billion of prospective trust capital.
SPAC IPOs (May 2026)
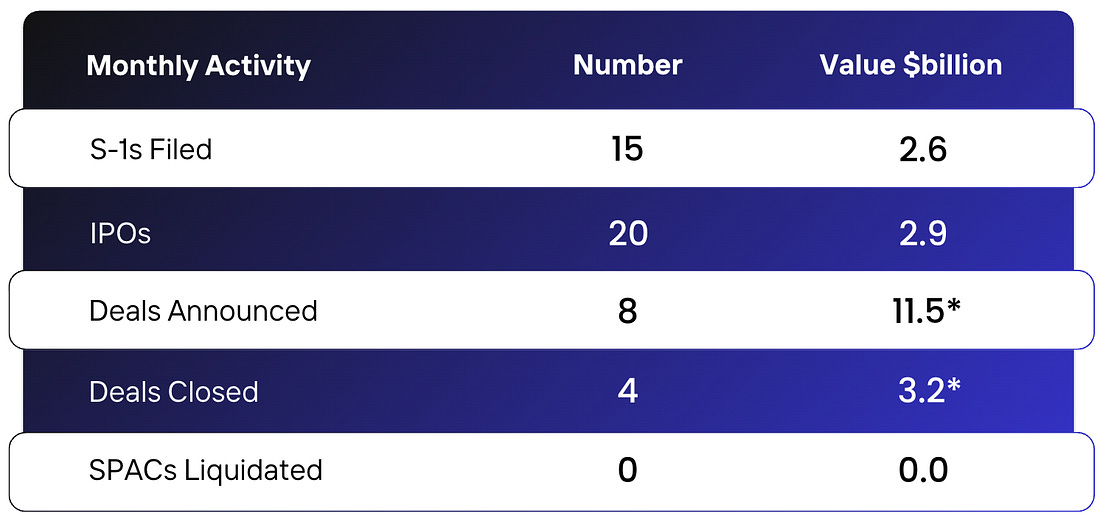
Activity remained broad-based and institutional, with steady IPO issuance, strong announced deal value, active de-SPAC closings and continued sponsor-led formation momentum.
- 20 SPAC IPOs raised $2.9 billion in May, led by Berto Acquisition Corp. II ($315m) and Tribeca Strategic Acquisition Corp. ($140m). Average trust share price held at $10.04 and median tenor at 17 months.
- 8 announced de-SPACs totaled $12.1 billion in enterprise value, led by ProLogium-TDAC ($3.8bn), Terra Quantum-Axiom Intelligence I ($3.6bn) and newcleo-NewHold III ($2.4bn).
- 4 de-SPACs closed for $4.4 billion in enterprise value. Boost Run-Willow Lane closed with 0% redemptions, while Enhanced Games (98.1%) and Hadron Energy (84.2%) completed transactions through alternative financing.
- 15 S-1 filings seeking $2.6 billion were led by Freedom Metals ($275m), Cantor Equity Partners VII ($250m) and three $200m vehicles, with repeat sponsors accounting for roughly half of the largest filings.
Heatmap: Growing Sectors and Geographies
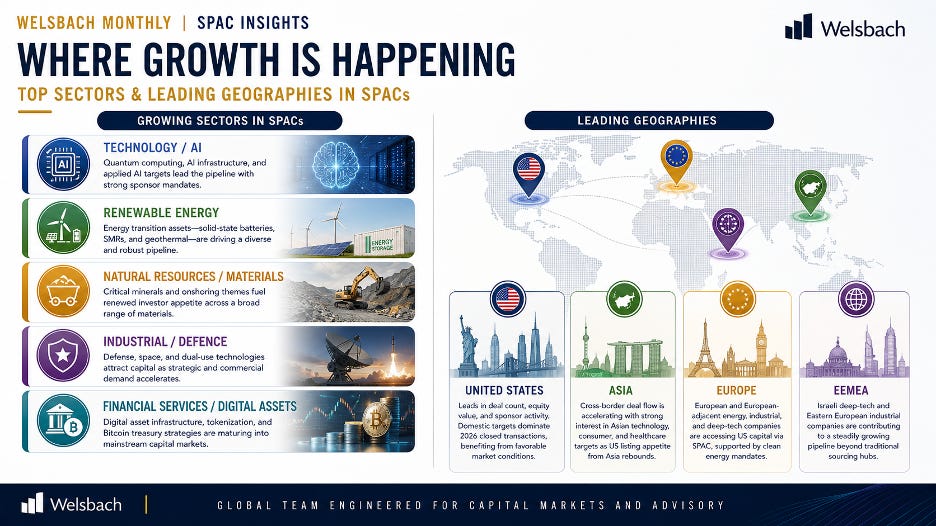
Growing sectors
- Technology and AI: the single largest sector by live deal equity value, with Terra Quantum ($3.6bn), Xanadu Quantum Technologies ($3.1bn) and Infleqtion ($1.8bn) establishing quantum computing as a defined sub-sector.
- Renewable energy: ProLogium ($3.8bn), newcleo ($2.4bn), Presidio Production ($735m) and Greenland Energy ($260m) reflect sustained interest in solid-state batteries, small modular reactors and geothermal.
- Natural resources and materials: US Elemental ($571m), Miotal ($10.0bn) and Evolution Metals ($5.9bn) anchor a sector driven by critical minerals policy and onshoring themes.
- Industrial and defence: Karman Holdings, Firefly Aerospace and NorthStar Earth & Space ($405m) reflect growing defense and dual-use technology deal flow.
- Financial services and digital assets: Cantor Equity Partners II ($1.8bn for Securitize), Procap Financial ($752m) and Twenty One Capital ($3.6bn) show digital asset infrastructure maturing into mainstream capital markets.
Leading geographies
- United States: dominant across deal count, equity value and sponsor origin, with domestic targets accounting for the majority of 2026 closed transactions.
- Asia: gaining share in the live pipeline through Aimei Health Technology / United Hydrogen Group ($1.6bn), BEST SPAC I and Healthcare AI / Leading Group ($573m).
- Europe: ProLogium, newcleo, Terra Quantum and ClimateRock/GreenRock represent a cluster of European targets accessing U.S. capital markets via SPAC.
- EMEA: Israel Acquisition Corp. / Gadfin ($180m) and Trasteel Holding ($1.3bn) reflect continued Israeli deep-tech and Eastern European industrials deal flow.
Conclusion
The May 2026 data confirms what the pipeline has been signaling for several months: the SPAC market has completed its structural reset and is operating with genuine institutional momentum. Market share at 61%, issuance on pace to exceed 160 IPOs for the full year, and a live deal pipeline carrying nearly $70 billion in equity value are not recovery statistics, they are expansion statistics.
The quality shift matters equally: redemption rates, sponsor composition, trust structures and target scale have all moved in the right direction. With $46 billion in trust actively searching for targets and the traditional IPO market entering its most active stretch since 2021, both channels are competing for the same category of institutional-quality assets.
For founders, boards and advisors evaluating public market timing and route, the current window offers more viable options and considerably better terms than any point in the past four years.
Download
Take this edition with you
Register once to download this Welsbach Monthly edition as a branded PDF, including all charts and exhibits.